


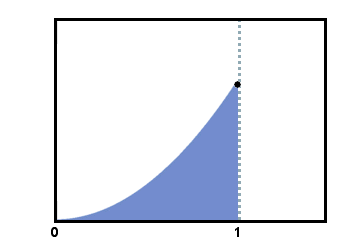
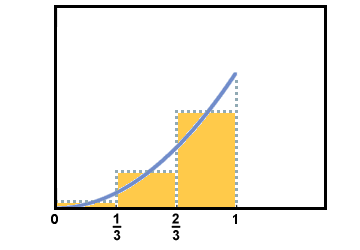
Approximate the area between the curve of y = x2 and the x - axis from x = 0 to x = 1:
The method to be used in this section to solve this problem is Riemann sums, which involves subdividing the region into rectangles of equal width and adding up the areas of all of the rectangles to approximate the area of the region.
Let's first use three subdivisions to approximate this area:
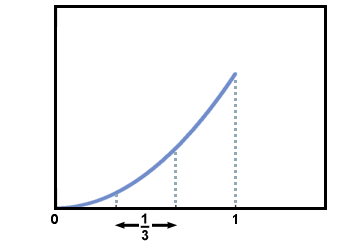
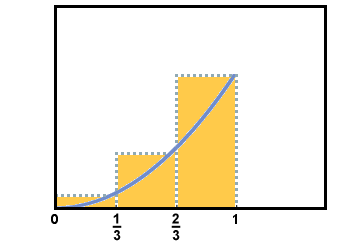
Each of the regions has a width of 1/3 the interval from x = 0 to x = 1 which is 1/3. These will form the bases of the rectangles, but what should be chosen for the height? One possibility would be to use the value of the function at the left endpoint of each subdivision as the height. This is called a left-hand approximation.
The left-hand approximation for the area is as follows:
 (0) +
(0) +  +
+  =
= 
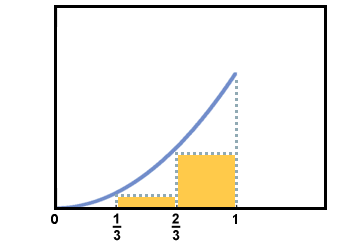
Another possibility is to use the value of the function at the right endpoint of each subdivision as the height. This is called a right-hand approximation.
The right-hand approximation for the area is as follows:
+ + (1) = 
Finally, a third possibility is to use the value of the function at the midpoint of each of the subdivisions as the height. This is called a midpoint approximation.
The midpoint approximation for the area is as follows:
( ) + (
) + ( ) + (
) + ( ) =
) = 
Each of these three methods seems reasonable, yet each generated a different result for the area. It seems as though no matter which point we choose for the height of the box, we will never get the exact area, since there is always a margin of error present.
However, it also seems intuitive that if 10 subdivisions or 100 subdivisions were used instead of only three, the error would decrease. This is indeed true. As the number of subdivisions increases, the accuracy of the approximation goes up regardless of what endpoint is being used as the height of the rectangles. This is a very important observation, but discussing it further requires the establishment of some notation first:
Let's generalize the procedure of doing left-hand approximations to find the area under
the graph of f on the closed interval [a, b] using n subdivisions. With equal subdivisions, each rectangle has a width
of Δx =  .
.
If we let x0 = a and xn = b, then x1 = x0 + Δx, x2 = x0 +2Δx, etc:
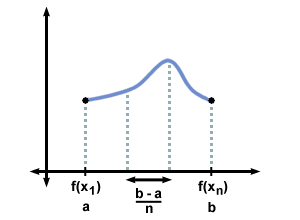
Each of the subdivisions uses the left endpoint for the height, so the height of the first subdivision is f (x0), the height of the second subdivision is f (x1), etc. Thus, Ln, the "nth left-hand approximation" is equal to
| Ln = f (x0)Δx + f (x1)Δx + ...f (xn-1)Δx |
Defining xk as x0 + kΔx allows us to collapse the left-hand approximation into:
Ln =  f (xk)Δx f (xk)Δx |
Similarly, the right-hand approximation could be written as
Rn =  f (xk)Δx f (xk)Δx |
Notice how this formula is just slightly different from the one for the left-hand approximation. It was conjectured previously that using more subdivisions would improve the accuracy of the approximations. To make this approximation exact, one would need an infinite number of subdivisions, and limits allow us to get close to this: if A is the exact area of a region bound by a function f, the x-axis, and the lines x = a and x = b, then
A =  Ln andA = Rn Ln andA = Rn |
This means that
A =  f(xk)Δx f(xk)Δx |
and
A =  nf(xk)Δx nf(xk)Δx |