What is Elasticity?
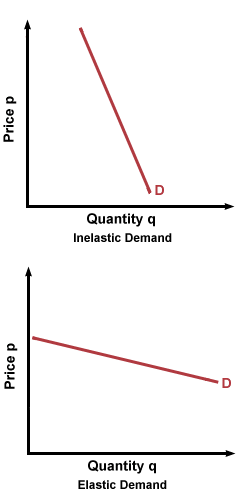
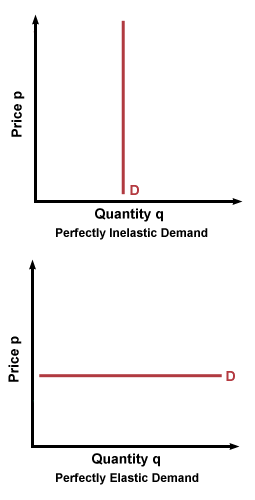
Elasticity refers to the degree of responsiveness in supply or
demand in relation to changes in price. If a curve is more elastic,
then small changes in price will cause large changes in quantity consumed. If a
curve is less elastic, then it will take large changes in price to effect a
change in quantity consumed. Graphically, elasticity can be represented by the
appearance of the supply or demand curve. A more elastic curve will be
horizontal, and a less elastic curve will tilt more vertically. When talking
about elasticity, the term "flat" refers to curves that are horizontal; a
"flatter" elastic curve is closer to perfectly horizontal.


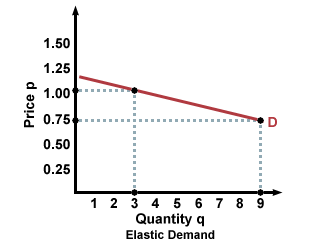
Price elasticity of demand, also called the elasticity of demand, refers to the degree of responsiveness in demand quantity with respect to price. Consider a case in the figure below where demand is very elastic, that is, when the curve is almost flat. You can see that if the price changes from $.75 to $1, the quantity decreases by a lot. There are many possible reasons for this phenomenon. Buyers might be able to easily substitute away from the good, so that when the price increases, they have little tolerance for the price change. Maybe the buyers don't want the good that much, so a small change in price has a large effect on their demand for the good.

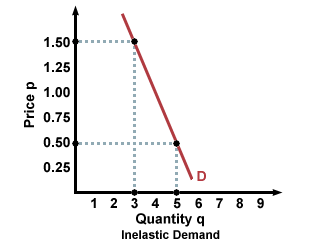
If demand is very inelastic, then large changes in price won't do very much to the quantity demanded. For instance, whereas a change of 25 cents reduced quantity by 6 units in the elastic curve in the figure above, in the inelastic curve below, a price jump of a full dollar reduces the demand by just 2 units. With inelastic curves, it takes a very big jump in price to change how much demand there is in the graph below. Possible explanations for this situation could be that the good is an essential good that is not easily substituted for by other goods. That is, for a good with an inelastic curve, customers really want or really need the good, and they can't get want that good offers from anywhere else. This means that consumers will need to buy the same amount of the good from week to week, regardless of the price.

Like demand, supply also has varying degrees of responsiveness to price, which we refer to as price elasticity of supply, or the elasticity of supply. An inelastic supplier (one with a steeper supply curve) will always supply the same amount of goods, regardless of the price, and an elastic supplier (one with a flatter supply curve) will change quantity supplied in response to changes in price.
How Is Elasticity Measured?
As we have noted, elasticity can be roughly compared by looking at the relative
steepness or flatness of a supply or demand curve. Thus, it makes sense that
the formula for calculating elasticity is similar to the formula used for
calculating slope. Instead of relating the actual prices and quantities of
goods, however, elasticity shows the relationship between changes in
price and quantity. To calculate the coefficient for elasticity, divide the
percent change in quantity by the percent change in price:
Elasticity = (% Change in Quantity)/(% Change in Price)
Remember that to find percent change itself, you divide the amount of change in
a variable by the initial level of the variable:
% Change = (Amount of Change)/(Initial Level)
Another important thing to remember is that percentage changes can be positive
or negative, but elasticity is always an absolute value. That is, even when an
increase in price is paired with a decrease in quantity (as with most demand
curves), the elasticity will be positive; remember to drop any minus signs when
finding your final value for elasticity.
Let's apply this and solve for elasticity in the market for ping pong balls.
When ping pong balls cost $1 each, Alice is willing to buy 10 balls, and Joe is
willing to sell 10 balls. When they cost $1.50 each, Alice is willing to buy 6
balls, and Joe is willing to sell 20. First, let's solve for Alice's price
elasticity of demand:
% Change in Quantity = (6-10)/10 = -0.4 = -40%
% Change in Price = (1.50-1)/1 = 0.5 = 50%
(-40%)/(50%) = -0.8
Take the absolute value to find elasticity.
Elasticity of Demand = 0.8
Now, we use the same process to find Joe's price elasticity of supply:
% Change in Quantity = (20-10)/10 = 1 = 100%
% Change in Price = (1.50-1)/1 = 0.5 = 50%
Elasticity of Supply = (100%)/(50%) = 2


