Profit
In the unit on supply, we established that sellers derive their utility from profits, or the amount of money that they actually make from a sale. Roughly speaking, this means that when the price of a good goes up, the seller will be happier, but there is more to profit than the sale price of a good. For instance, we would think that Kenny, who sells shirts, would be happier if the selling price went from $20 a shirt to $25 a shirt. If nothing else changes, then that's true: he will be happier at the higher price. If with the higher sale price his costs change, however, from an initial cost of $10 a shirt to a cost of $17 a shirt, then he would have been happier at the lower price, since his profits now are actually decreased.
Profit = Total Revenue (TR) - Total Cost (TC)Kenny's initial profit per shirt is:
Profit = 20 - 10 = $10 a shirtAfter the change in both selling price and costs, however, his new profit per shirt is:
Profit = 25 - 17 = $8 a shirtThis is a very basic look at why there is more to seller utility than just selling price. If we look more closely, we can find better ways to represent costs, revenue, and profits.
The following graphs shows different ways of looking at revenue:
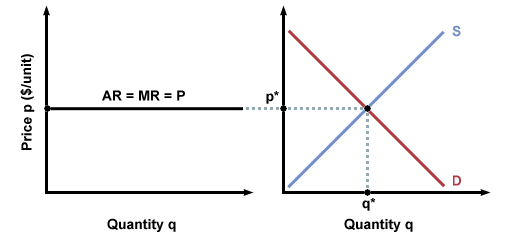
TR = pqAverage revenue (AR) is the average amount of money that the firm gets per unit of goods. This is equal to p, the market price, since the firm cannot decide how much people will pay for its goods.
AR = TR/qMarginal revenue (MR) is the extra amount of revenue generated by selling one additional unit of goods. It is equal to the slope of the TR curve:
AR = p
MR = (change in TR)/(change in q)MR will also be equal to p, since we assume that the firm is not big enough to significantly affect the market through its actions. That is, the firm will not affect the market price of a good, no matter how much or how little it sells. Thus, for every additional unit it sells, its marginal revenue will be p:
MR = pNote that we can draw the graph of market equilibrium next to the graph of marginal revenue and average revenue. Extending the revenue line into the equilibrium graph, we see that this line hits right at the equilibrium point.
The following graph shows different ways of measuring and representing costs of
production:
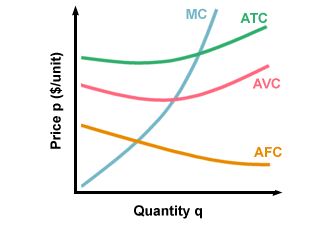
Total cost (TC) is the sum of all the different costs they incur when
producing and selling their product.
Average cost (AC) is the total cost divided by the quantity of goods:
AC = TC/qMarginal cost (MC) is the extra cost incurred in producing one more of the product. This can be found by measuring the slope of the TC curve:
MC = (change in TC)/(change in q)Costs can also be broken down into types of costs:
- Total variable costs (TVC) refers to costs which vary with the amount of goods a firm makes and sells. An example of TVC could be the cost of chocolate chips, if the firm makes chocolate chip cookies.
- Total fixed costs (TFC) refers to costs THAT a firm has to pay, no matter how much or how little it produces. One example might be the monthly rent on a store.
TVC + TFC = TCTVC and TFC, when divided by q, yield average variable cost (AVC) and average fixed cost (AFC):
AVC = TVC/qAdded together, AVC and AFC are equal to AC:
AFC = TFC/q
AVC + AFC = ACWe can also find the marginal variable cost (MVC) and the marginal fixed cost (MFC) by taking the slopes of the two curves. Because fixed costs don't change with quantity, however, the MFC will be 0:
MVC = (change in TVC)/(change in q)Added together, MVC and MFC are equal to MC, but since MFC is 0, the marginal cost is equal to the marginal variable cost:
MFC = (change in TFC)/(change in q) = 0
MVC + MFC = MC
MVC + 0 = MC
MVC = MC
If we can combine a firm's costs and revenues, we can calculate the firm's profits. Using the variables we have been working with, we can represent profit as:
Profit = TR - TCFirms will try and maximize their profits, since it is through increasing profits that firms increase their utility. To maximize profits, firms will choose to sell the quantity at which the marginal cost is equal to the marginal revenue. Why is this true? If MC were greater than MR, then the firm would be losing money for each additional unit of product. If MR were greater than MC, the firm would be losing out on extra profit by not making another unit. The following graph shows this ideal quantity as q*. The shaded region is the amount of profit that the firm generates:
TR - TC = q(AR - AC) = q(P - AC)
Profit = q(P - AC)
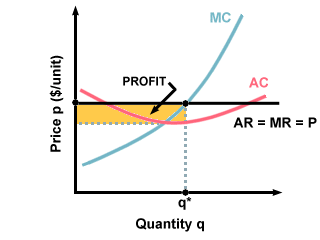
If the firm is making profits, that is, if P is greater than the average cost, then all is well, they will continue producing and selling goods. If P is less than AC, however, the firm is losing money.
P < AC : the firm is losing moneyHow will the firm respond to this? Firms make decisions differently for the short run and the long run.
In the short run, (in economic terms, the immediate future), it is not feasible to "close shop" immediately. There are leases to end, bills to pay, creditors to pay off, and other concerns to take care of first. In such a case, the firm can make two choices: either to continue producing and selling goods for the time being (in order to minimize losses), or to stop production altogether (to cut losses). How does a firm decide which path to take? This decision is based on the firm's variable costs. If the price is still higher than the average variable cost, it will continue production, if the price is lower than the average variable cost, it will shut down.
P > AVC : continue production in the short runWhy is this? Think about it this way: in the first case, the firm is losing money in the big picture. Each unit that they make incurs some variable cost, but because that cost is lower than the price, they keep producing, since they can still recoup some of their losses by continuing production.
P < AVC : stop production in the short run
In the second case, each additional unit of goods incurs more costs than revenue, since the average variable costs are higher than the selling price of the goods. It doesn't make sense for the firm to keep producing, since it will only make their losses even greater.
In the long run, firms make the decision either to stay in the market, or to leave the market. (Leaving the market is different from stopping production: a firm can temporarily halt production with the intention of starting up once it becomes profitable again. Leaving the market is much more permanent.) How do they make this decision?
Firms still look at the relationship between their average cost (AC) and price. In the short run, firms will sometimes decide to continue production even if their costs exceed the market price, in the long run firms will exit the market if P < AC, since they are losing money, and they have the option to leave the market. When prices rise in a market, more firms will enter, since they will be able to produce goods at a lower average cost than the market price. When the price falls, however, those firms who cannot produce at AC < p have to exit. Firms will produce at their minimum AC in order to make as much money as possible, and to avoid having to leave the market.
This means that any firm that cannot produce at an average cost below the market price will be forced out of the market, and in the long run, firms will earn no profits from producing and selling their goods. Competition forces firms with higher costs to either cut costs or leave the market until the market price is equal to the average cost incurred by firms still in the market. In the long run,
P = AC
Special Case: Monopolies
Monopoly refers to a situation in which one firm is the only seller in a market. This usually results in very high prices, since there is no competition to keep prices in check. For example, Pepsi and Coke cost about the same amount of money. If Pepsi were to charge twice as much, most people would choose to buy Coke, and Pepsi would lose business and revenue. However, if Coke did not exist, and Pepsi were the only cola supplier in the market, Pepsi could charge twice as much; without any other options, people would buy Pepsi at the higher price, and Pepsi would have a huge profit margin.
In a competitive market, firms are price-takers, that is, they are too small to be able to set prices for the market to follow, so they cannot charge as much as they want, since their competitors can undercut them and win all of the customers. Monopolists, however, can set prices as they please, since they have no fear of competition.
You may recall that in a competitive market, firms decide how much output to
produce by finding the point at which marginal revenue is equal to marginal
cost. Since MR = P, they simply find the intersection of their MC curve and
price. In competitive markets where firms are price-takers, the demand curve is
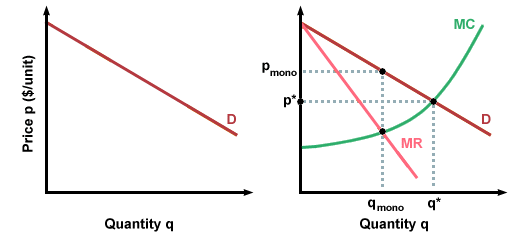
horizontal along the price level, so that D = AR = MR = P:
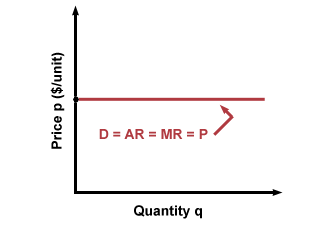
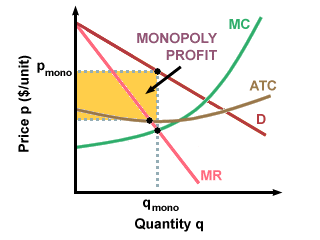
Monopolists will find their profit-maximizing point by finding the intersection
between their downward-sloping MR curve and their MC curve. Note that in a
monopolist market, MR does not equal D, so the profit-maximizing point chosen by
a monopolist results in higher prices and lower consumption than in a
competitive market.
In certain markets there are natural monopolies, monopolies that will
naturally occur in the market (as opposed to a monopoly that occurs because one
firm pushes or buys other firms out). What kind of market would naturally lead
to the formation of a monopoly? If there is a product that has a downward-
sloping average cost curve (as opposed to the U-shaped curves we have been
working with), then it is likely that a natural monopoly will form.
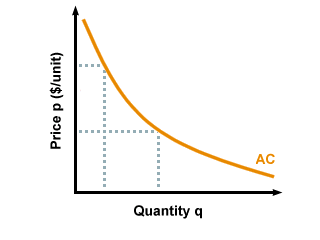
Why is this true? Let's say that in the market for computers, Eliot Computer
Lab ("ECL") gets a head start on production, and has already made 1000 units
before its competitors get started. At that point, ELC has a much lower average
cost than the new firms, and therefore has a significant advantage over its
competitors, since it can charge lower prices and make more profits. If it ever
feels threatened by new firms, it can increase production and lower the price
even more, so that the new firms cannot compete, since they are still further
back on the cost curve. In such a case, ECL would have a natural monopoly in
the computer market, and other firms would exit the market.


 payment page


