A typical polar equation is in the form r = f (θ), where f is some function ( of θ). θ is the independent variable, and r is the dependent variable. The graph of a polar equation is the collection of all points that have at least one set of polar coordinates that satisfy the equation (remember that a point has more than one set of polar coordinates). Polar equations can be graphed by plotting points, and ultimately, this is the best way to do it. But there are a number of shortcuts that are useful for graphing polar equations.
Symmetry is an important property of any graph. Like functions are either odd, even, or
neither, based on their symmetry properties, graphs of polar equations can be symmetric
with respect to either the polar axis, the pole, or the line θ =  , or none
of these. Knowing whether a graph is symmetric in any way simplifies the graphing
process.
If in the polar equation, (r, θ) can be replaced by (r, - θ)or(- r, Π - θ),
the graph is symmetric with respect to the polar axis. If in the polar equation, (r, θ) can be replaced by (- r, θ)or(r, Π + θ), the graph is symmetric with
respect to the pole. If in the polar equation, (r, θ) can be replaced by (r, Π - θ)or(- r, - θ), the graph is symmetric with respect to the line θ =  . These rules are true, of course, but their converses are not. The graph of
a polar equation can be symmetric with respect to one of these axes (or the pole) and not
satisfy any of the test equations. These rules are only used to help sketch a graph.
Finding the maximum absolute value of r and the θ values for which r = 0 is also a useful technique in sketching and analyzing the graph of a polar equation. If for some θ, r = 0, the graph intersects the pole.
One final technique for sketching and analyzing the graph of a polar equation is finding
the intercepts of the graph; that is, where it intersects the lines θ = 0 and θ =  . These lines correspond to the x and y axes in the rectangular
coordinate system. Let's examine a polar equation and sketch and analyze it.
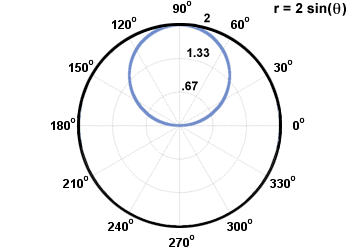
r = 2sin(θ). It is not uncommon for a polar equation to contain a trigonometric
function, like this one. Performing the symmetry tests, it is found that, because
sin(θ) = sin(Π - θ), the graph is symmetric with respect to the line θ =  . This means we only need to plot values of θ for [0,
 ]and[
]and[ , 2Π), or[
 , Π]and (Π,
 ]. If we can
plot the graph for values of θ in either of these two sets of intervals, we can use the
symmetry of the graph to sketch it for the other values of θ. The maximum
absolute value of r occurs when sin(θ) = 1or - 1; therefore, θ =
  ,
, , and r = 2, - 2, respectively. Both of these ordered
pairs specify the same point. r = 0 when sin(θ) = 0, which is true for θ = 0, Π. Finally, evaluating the equation at θ = 0,
 , we find the
intercepts are at (0, 0)and (2,
 ).
).
At this point, we plot some sample points of the equation, along with the maximum and
zero values of r and the intercepts. Using the symmety of the graph, we find that the
graph looks like this:
There are a few well-known names for special kinds of graphs which are more simply defined by polar equations than rectangular.
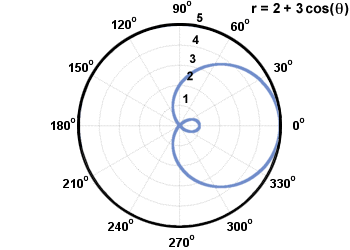
A limacon is a curve with the equation r = a + b sin(θ)orr = a + b cos(θ), where a, b≠ 0. Below is the limacon r = 2 + 3 cos(θ).
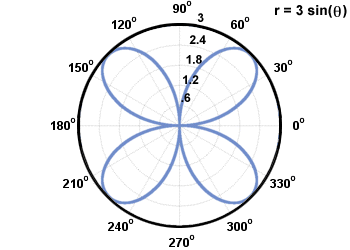
A rose curve is a curve with the equation r = a sin(nθ) or r = a cos(nθ), where n is an integer. Each loop in a rose curve is called a petal. The number of petals in a given curve is n if n is odd, and 2n if n is even. The length of each petal is a. Below is the rose curve r = 3 sin(2θ).
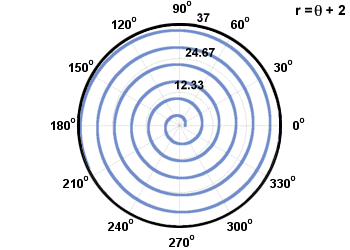
Two common kinds of spirals are called spirals of Archimedes and logarithmic spirals. A spiral of Arhcimedes is of the form r = aθ + b, and a logarithmic spiral is of the form r = abθ. They are pictured below.
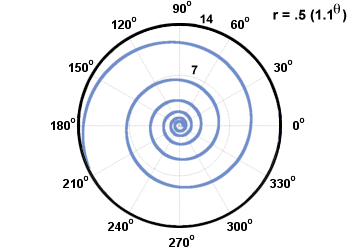
The common circle with its center at the pole comes from the equation r = c, where c is a constant. A circle that intersects the pole once comes from the equation r = a sin(θ) or r = a cos(θ), with a diameter of a. The example explained earlier is a circle that intersected the origin once.
Because polar equations often contain trigonometric functions, their graphs often repeat themselves (the trigonometric functions are periodic). In such cases, the entire graph may be traced within a small interval of values of θ. Usually, the period of the given trigonometric function is sufficient to trace the entire graph, but sometimes it is not.
The safest way to graph a polar equation is to plot points until you have a feel for what the graph looks like. All of the hints in this section are only aids in sketching a graph of a polar equation.


