Introduction to Aggregate Supply
In the previous SparkNote we learned that aggregate demand is the total demand for goods and services in an economy. But the aggregate demand curve alone does not tell us the equilibrium price level or the equilibrium level of output. In order to obtain this information, we need to add the aggregate supply curve to the diagram containing the aggregate demand curve. Then, and only then, do the equilibrium values of the economy in the AS-AD model appear.
The aggregate supply curve shows the relationship between the price level and the quantity of goods and services supplied in an economy. The equation for the upward sloping aggregate supply curve, in the short run, is Y = Ynatural + a(P - Pexpected). In this equation, Y is output, Ynatural is the natural rate of output that exists when all productive factors are used at their normal rates, a is a constant greater than zero, P is the price level, and Pexpected is the expected price level. This equation holds only in the short run because in the long run the aggregate supply curve is a vertical line, as output is dictated by the factors of production alone.
But what does the equation for the aggregate supply curve mean? Basically, this equation means that output deviates from the natural rate of output when the price level deviates from the expected price level. The constant, a, shows how much output changes due to unexpected deviation in the price level. It is also important to notice that the slope of the aggregate supply curve is (1/a).

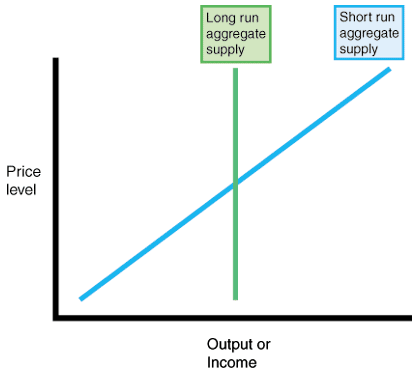
depicts the short-run aggregate supply curve and the long- run aggregate supply curve. Notice that the axes are the same as for the aggregate demand curve. The vertical axis is the price level. The horizontal axis is output or income. Also notice that the short-run aggregate supply curve is downward sloping with slope equal to (1/a) while the long-run aggregate supply curve is vertical with no slope.
Aggregate Supply in the Short Run
The equation for aggregate supply presented above holds only in the short run. Recall that the aggregate supply curve shows the relationship between the price level and the quantity of goods and services supplied. Also recall that the aggregate supply curve states that output deviates from the natural rate of output when the price level deviates from the expected price level. All of these elements of aggregate supply point to an upward sloping short-term aggregate supply curve and a vertical long-term aggregate supply curve.
But how do we know that aggregate supply is upward sloping in the short run and vertical in the long run? First, recall from microeconomics that output is a function of capital and labor--the inputs to production. Thus, in the long run, the levels of capital and labor in an economy fix the level of output. The only way to increase output in the long run is to increase the levels of capital and labor. This is called increasing the capital stock--the result of investment--and increasing the labor force--the result of more people working. Therefore, in the long run, the aggregate supply curve is affected only by the levels of capital and labor and not by the price level. Thus, the long run aggregate supply is vertical with respect to the price level.
The reason that the short-term aggregate supply curve is upward sloping is a bit more complex. There are four basic explanatory models, which will be explained in detail in the next section. These models are the sticky-wage model, the worker- misperception model, the imperfect-information model, and the sticky-price model. In their own ways, each of these models explains why output deviates from the natural rate of output when the price level deviates from the expected price level.


 payment page


