Did you know you can highlight text to take a note?
x

Please wait while we process your payment
If you don't see it, please check your spam folder. Sometimes it can end up there.
If you don't see it, please check your spam folder. Sometimes it can end up there.
Please wait while we process your payment
By signing up you agree to our terms and privacy policy.
Don’t have an account? Subscribe now
Create Your Account
Sign up for your FREE 7-day trial
By signing up you agree to our terms and privacy policy.
Already have an account? Log in
Your Email
Choose Your Plan
Individual
Group Discount
Save over 50% with a SparkNotes PLUS Annual Plan!
 payment page
Purchasing SparkNotes PLUS for a group?
Get Annual Plans at a discount when you buy 2 or more!
Price
$24.99 $18.74 /subscription + tax
Subtotal $37.48 + tax
Save 25% on 2-49 accounts
Save 30% on 50-99 accounts
Want 100 or more? Contact us for a customized plan.
payment page
Your Plan
Payment Details
Payment Summary
SparkNotes Plus
You'll be billed after your free trial ends.
7-Day Free Trial
Not Applicable
Renews July 8, 2025 July 1, 2025
Discounts (applied to next billing)
DUE NOW
US $0.00
SNPLUSROCKS20 | 20% Discount
This is not a valid promo code.
Discount Code (one code per order)
SparkNotes PLUS Annual Plan - Group Discount
Qty: 00
SparkNotes Plus subscription is $4.99/month or $24.99/year as selected above. The free trial period is the first 7 days of your subscription. TO CANCEL YOUR SUBSCRIPTION AND AVOID BEING CHARGED, YOU MUST CANCEL BEFORE THE END OF THE FREE TRIAL PERIOD. You may cancel your subscription on your Subscription and Billing page or contact Customer Support at custserv@bn.com. Your subscription will continue automatically once the free trial period is over. Free trial is available to new customers only.
Choose Your Plan
This site is protected by reCAPTCHA and the Google Privacy Policy and Terms of Service apply.
For the next 7 days, you'll have access to awesome PLUS stuff like AP English test prep, No Fear Shakespeare translations and audio, a note-taking tool, personalized dashboard, & much more!
You’ve successfully purchased a group discount. Your group members can use the joining link below to redeem their group membership. You'll also receive an email with the link.
Members will be prompted to log in or create an account to redeem their group membership.
Thanks for creating a SparkNotes account! Continue to start your free trial.
We're sorry, we could not create your account. SparkNotes PLUS is not available in your country. See what countries we’re in.
There was an error creating your account. Please check your payment details and try again.
Please wait while we process your payment
Your PLUS subscription has expired
Please wait while we process your payment
Please wait while we process your payment
Graphing Equations Using Intercepts
The x-intercept is the point at which a line crosses the x-axis; i.e. the point at which y = 0. The y-intercept is the point at which a line crosses the y-axis; that is, the point at which x = 0. These concepts depend upon writing a linear equation using variables x and y, which is both standard and implicit in our identification of such an equation with the straight line that is its graph.
To find the x-intercept, set y = 0 and solve the equation. For example, to find the x-intercept of 5y - 2x = 10:
5(0) - 2x = 10
-2x = 10
x = - 5
Thus, the x-intercept, or the point at which the line crosses the horizontal axis, is (- 5, 0).
To find the y-intercept, set x = 0 and solve the equation. For example to find the y-intercept of 5y - 2x = 10:
5y - 2(0) = 10
5y = 10
y = 2
Thus, the y-intercept, or the point at which the line crosses the vertical axis, is (0, 2).
Hence, to find the intercept of either variable, set the other variable equal to 0 and solve for the original variable.
As observed in the last section, we only really need two points to graph a line. Usually, the two easiest points to find are the x-intercept and the y-intercept. Once these have been found, we can plot them, draw a straight line connecting them, and extend the line at either end. Here is a graph of the equation 5y - 2x = 10, drawn using intercepts:
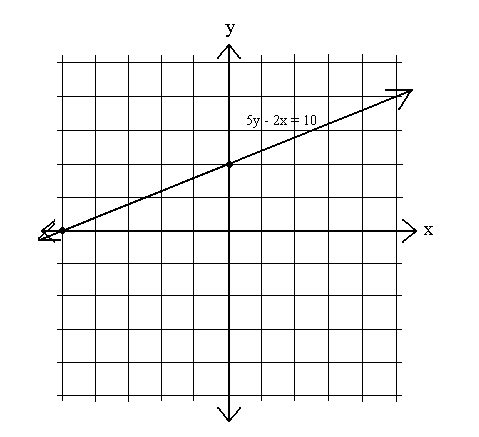
Graph of 5y - 2x = 10
It is important to point out that, no matter what technique we use to graph an equation, the graph of the equation is always the same -- all techniques will yield the exact same graph.
Please wait while we process your payment