Did you know you can highlight text to take a note?
x

Please wait while we process your payment
If you don't see it, please check your spam folder. Sometimes it can end up there.
If you don't see it, please check your spam folder. Sometimes it can end up there.
Please wait while we process your payment
By signing up you agree to our terms and privacy policy.
Don’t have an account? Subscribe now
Create Your Account
Sign up for your FREE 7-day trial
By signing up you agree to our terms and privacy policy.
Already have an account? Log in
Your Email
Choose Your Plan
Individual
Group Discount
Save over 50% with a SparkNotes PLUS Annual Plan!
 payment page
Purchasing SparkNotes PLUS for a group?
Get Annual Plans at a discount when you buy 2 or more!
Price
$24.99 $18.74 /subscription + tax
Subtotal $37.48 + tax
Save 25% on 2-49 accounts
Save 30% on 50-99 accounts
Want 100 or more? Contact us for a customized plan.
payment page
Your Plan
Payment Details
Payment Summary
SparkNotes Plus
You'll be billed after your free trial ends.
7-Day Free Trial
Not Applicable
Renews July 17, 2025 July 10, 2025
Discounts (applied to next billing)
DUE NOW
US $0.00
SNPLUSROCKS20 | 20% Discount
This is not a valid promo code.
Discount Code (one code per order)
SparkNotes PLUS Annual Plan - Group Discount
Qty: 00
SparkNotes Plus subscription is $4.99/month or $24.99/year as selected above. The free trial period is the first 7 days of your subscription. TO CANCEL YOUR SUBSCRIPTION AND AVOID BEING CHARGED, YOU MUST CANCEL BEFORE THE END OF THE FREE TRIAL PERIOD. You may cancel your subscription on your Subscription and Billing page or contact Customer Support at custserv@bn.com. Your subscription will continue automatically once the free trial period is over. Free trial is available to new customers only.
Choose Your Plan
This site is protected by reCAPTCHA and the Google Privacy Policy and Terms of Service apply.
For the next 7 days, you'll have access to awesome PLUS stuff like AP English test prep, No Fear Shakespeare translations and audio, a note-taking tool, personalized dashboard, & much more!
You’ve successfully purchased a group discount. Your group members can use the joining link below to redeem their group membership. You'll also receive an email with the link.
Members will be prompted to log in or create an account to redeem their group membership.
Thanks for creating a SparkNotes account! Continue to start your free trial.
We're sorry, we could not create your account. SparkNotes PLUS is not available in your country. See what countries we’re in.
There was an error creating your account. Please check your payment details and try again.
Please wait while we process your payment
Your PLUS subscription has expired
Please wait while we process your payment
Please wait while we process your payment
The Concept of the Derivative
Any two points can be used in determining the slope of a line, because the slope is constant throughout. Now consider the challenge of trying to find the slope of the following figure:
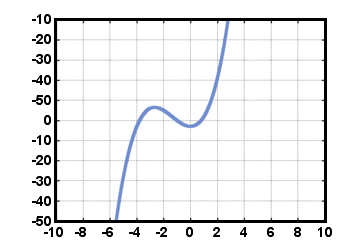
It should be readily apparent that there is no single slope for this figure. Instead, the curve has a
different slope at each separate point. Therefore, for non-linear figures, it makes sense only
to talk about the slope at a particular point.
Example: Find the slope of the graph of f at an arbitrary point x.
To visualize what needs to be done, let's consider an arbitrary function f and delineate
an arbitrary point x:
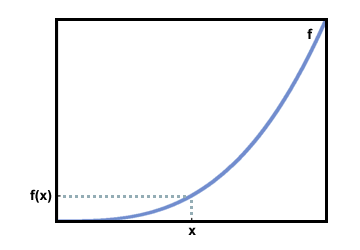
The question asks us to find the slope of f at this arbitrary point x.
The method with which we are already familiar calls for picking two points on the curve
and calculating  , so lets proceed this way first.
Clearly, one of the points we should use is the point (x, f (x)), since this is the point on
the graph where we want to find the slope. But what should be chosen as the other point?
Intuitively, it might seem that no other point would yield the right answer, since we are
interested in the slope at the single point (x, f (x)) only. Nevertheless, let us pick an
arbitrary point h units away on the x-axis, (x + h, f (x + h)):
, so lets proceed this way first.
Clearly, one of the points we should use is the point (x, f (x)), since this is the point on
the graph where we want to find the slope. But what should be chosen as the other point?
Intuitively, it might seem that no other point would yield the right answer, since we are
interested in the slope at the single point (x, f (x)) only. Nevertheless, let us pick an
arbitrary point h units away on the x-axis, (x + h, f (x + h)):
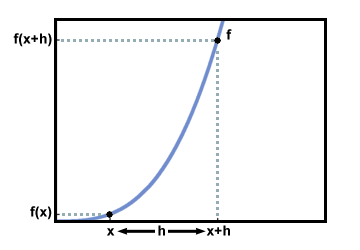
Now, we can calculate the quantity
for these two points:
 | =  | ||
| =  |
This quantity,
|
is called the difference quotient. It does not represent the slope of the graph at (x, f (x)). Rather, it represents the slope of the secant line that goes through the points (x, f (x)) and (x + h, f (x + h)):
Please wait while we process your payment