


Both phylogenetic trees and cladograms are diagrams used to illustrate the evolutionary relationships among species. These diagrams are based on common ancestry and shared traits. Phylogenetic trees, as shown in figure 7.6, are branching diagrams. They are based on morphological and genetic data (when available) and are designed to show the evolutionary history of species. Each branch of the tree represents a different lineage. Each node, or point where branches split, represents a common ancestor. The ends of each branch represent a species that exists today. Phylogenetic trees are able to show the relative timing of speciation by equating the amount of evolutionary change with the length of the branches. These distances are calibrated using fossils and genetic evidence. Cladograms are similar but are primarily based on shared characteristics between organisms. They represent a hypothesis of how organisms may have evolved but are not associated with genetic evidence or evolutionary time. Organisms within a cladogram that share a common ancestor form a clade and are found next to each other in the diagram. The lineage that is furthest from the other species is called the outgroup and is the lineage that is least closely related to the other organisms.
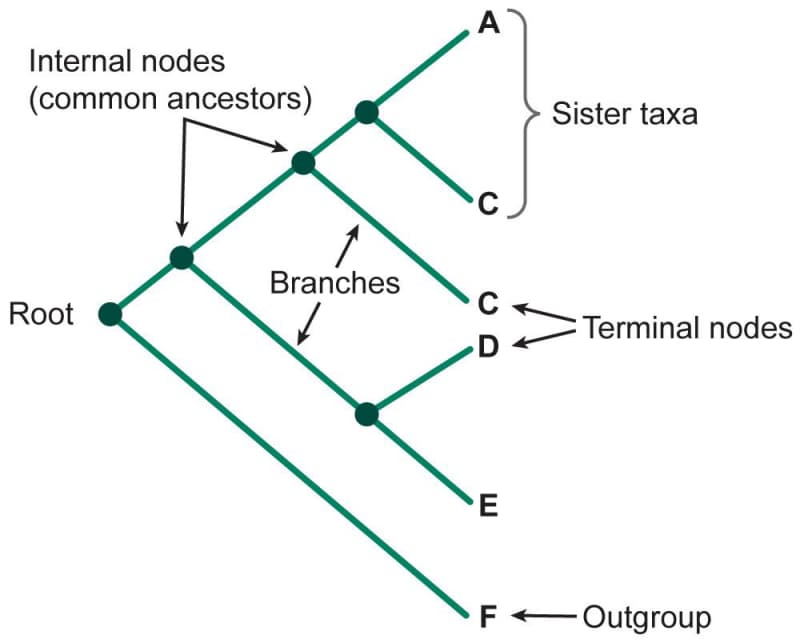
Figure 7.06: Example of a cladogram where letters A through F represent different species.
Many kinds of information are used to inform phylogenetic trees and cladograms. This is critical because shared characteristics may appear in more than one lineage. Deciphering which shared characteristics are due to common ancestry and which are due to convergent evolution has become easier as our ability to analyze genetic data has improved. Molecular data typically provides more reliable evidence and in recent years has transformed the way we view the evolutionary relationships between organisms.


