An economist named A. W. Phillips showed that historically, unemployment and inflation were inversely related: inflation rose as unemployment fell, and inflation fell as unemployment rose. Phillips's discovery was an important conceptual breakthrough, but it also made plain the limits of what policymakers can realistically hope for in managing the economy. If lowering unemployment raises inflation, and vice versa, policymakers can’t expect to reduce unemployment and inflation at the same time. The best they can hope for is to hold the economy reasonably steady at a point where inflation and unemployment are both at acceptable levels.
The Phillips Curve
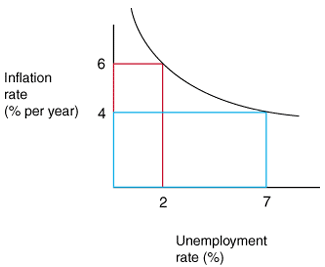
Phillips's discovery can be represented as a curve, called, aptly, the Phillips curve.

The Phillips curve shown is just an example. The actual Phillips curve for a country will vary depending upon the years that it aims to represent.
Notice that the inflation rate is represented on the vertical axis in units of percent per year. The unemployment rate is represented on the horizontal axis in units of percent. The curve shows the levels of inflation and unemployment that tend to match together approximately, based on historical data. In this curve, an unemployment rate of 7% seems to correspond to an inflation rate of about 4%, while an unemployment rate of 2% seems to correspond to an inflation rate of about 6%. As unemployment falls, inflation increases.
Problems with the Phillips Curve and Stagflation
The Phillips curve is theoretically interesting, but it does a poor job of predicting the future. In particular, the Phillips curve does a terrible job of explaining the relationship between inflation and unemployment from 1970 to 1984. Inflation in these years was much higher than would have been expected given the unemployment rate during these years. The combination of high inflation and high unemployment is called stagflation.
The Phillips curve must therefore not be looked at as a well-defined curve the economy moves back and forth on. Instead, the curve describes a qualitative relationship that characterizes most, but not all historical periods.


