


We have seen what a market looks like from the point of view of an outside observer. In this chapter, we consider the position of a single firm acting as one of the sellers in a market. The firm will want to maximize its profits, but what does that involve?
The first thing to understand about profit is that it comes in two versions, accounting profit and economic profit. They differ by how costs are factored in:
\(\text{Accounting Profit} = \text{Total Revenues} - \text{Explicit Costs}\)
and
\(\text{Economic Profit} = \text{Total Revenues} - \text{Total Costs}\)
Explicit costs include outlay for materials, rent for a sales facility, wages for staff, and so on. These are all out-of-pocket expenses that would be recorded by a bookkeeper. Subtracting explicit costs from total revenues (which we’ll get to in a moment) yields the accounting profit—in essence, the amount by which the firm’s bank balance changed.
Total costs include both explicit costs and implicit costs, which is really just another name for opportunity costs. Suppose that Kenny, who sells T-shirts, is breaking even at the accounting level: money in (total revenues) equals money out (explicit costs), so the accounting profit equals zero. Now imagine that Kenny is running his operation out of a house he owns free and clear, which sits on a piece of land a developer has offered a hefty sum for. Kenny could sell the house and the land and use the proceeds to buy a place in a nice but affordable neighborhood someplace else, where he could restart his operation and have cash on hand to buy new equipment and take other steps to increase his accounting profitability. If that is the situation, then Kenny is incurring a significant opportunity cost and is running a negative economic profit. This is something he should keep in mind. (But of course Kenny may love his current location so much, perhaps because of the view, that he’s content to stay put.)
Total revenue (\(TR\)) is the total amount of money a firm takes in by selling a certain quantity of goods. To find \(TR\), multiply the price of the goods by the quantity of goods sold:
\(TR = pq\)
Average revenue (\(AR\)) is the average amount of money that the firm gets per unit of goods. This is equal to \(p\), the market price.
\(AR = TR/q = p\)
Marginal revenue (\(MR\)) is the extra amount of revenue generated by selling one additional unit. Let us assume, for now, that the firm is not big enough to significantly affect the market through its actions. (We will later consider situations where this assumption doesn’t hold.) Then price p is independent of quantity, and so the firm’s revenue simply increases by \(p\) with each additional unit sold. Thus, the marginal revenue, like the average revenue, will be \(p\):
\(MR = p\)
Note that we can draw the graph of market equilibrium next to the graph of marginal revenue and average revenue. Extending the revenue line into the equilibrium graph, we see that this line hits right at the equilibrium point.
Now to costs. Again, total cost (\(TC\)) is the sum of all the different costs a firm incurs, both explicit and implicit. Costs can also be broken down into types of costs:
-
Total variable costs (\(TVC\)) refers to costs that vary with the amount of goods or services a firm makes and sells. An example of \(TVC\) could be the cost of chocolate chips, if the firm makes chocolate chip cookies.
-
Total fixed costs (\(TFC\)) refers to costs a firm has to pay, no matter how much or how little it produces. One example might be the monthly rent on a store location.
Added together, \(TVC\) and \(TFC\) are equal to \(TC\):
\(TVC + TFC = TC\)
Dividing \(TVC\), \(TFC\), and \(TC\) each by \(q\) yields average variable cost (\(AVC\)), average fixed cost (\(AFC\)) and average total cost (\(ATC\)):
\(ATC = TC/q\)
And, of course,
\(AVC + AFC = ATC\)
The characteristic shapes of the \(AVC\), \(AFC\) and \(ATC\) curves are as shown in this graph:
The \(AFC\) curve steadily decreases because as more units are produced and sold, the fixed costs associated with the production operation are spread out over more and more units. The \(AVC\) curve initially slopes downward for the same reason, but it usually happens that beyond a certain output quantity, \(AVC\) starts to rise again. The reason for this is that as output grows in a production facility of fixed size, production processes eventually start to get less efficient. Workers may have to be paid overtime wages. Parts may get harder to source in sufficient quantity and therefore may get more expensive. And so on.
The \(ATC\) curve is simply the vertical sum of the \(AFC\) and \(AVC\) curves. So long as it is sloping downward, the firm is enjoying economies of scale, where overall per-unit production cost is going down and the profit on each item is going up (since the price is constant). But when the \(ATC\) curve starts to turn upward, the firm should start thinking about how much more it wants to increase its output.
Marginal cost (\(MC\)) is the extra cost generated by making and selling one additional unit. It is of special interest because it supplies the right half of the profit-maximizing rule:
\(MR = MC\)
In words: to maximize profits, firms should produce and sell that quantity at which the marginal cost is equal to the marginal revenue. Why is this true? When \(MC\) is greater than \(MR\), the firm is losing money on the last few units produced and should cut back. And when \(MR\) is greater than \(MC\), the firm is losing out on extra profit by not producing more units. The following graph shows this ideal quantity as \(q*\). The shaded region is the amount of profit that the firm generates:
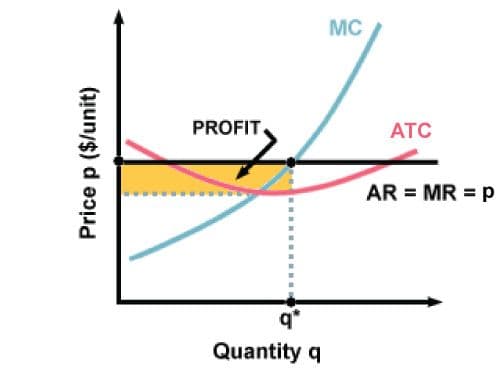
The ideal production quantity is the quantity where \(MR = MC\), that is, where the \(MR\) and \(MC \) curves cross. The amount of profit will appear as a rectangle whose length is the distance between average total cost and price (since that reflects the average amount gained per unit) and whose width is the number of units sold. To calculate the actual amount of the profits, you would multiply the length (dollars per unit) and the width (quantity) of the shaded rectangle. It is possible for profits to be negative (in the case that the "profit" rectangle is above the average revenue curve, instead of below it.


