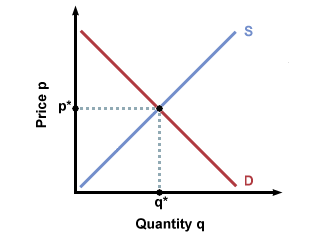
To find market equilibrium, we combine the demand curve and the supply curve in one graph. The point of intersection of supply and demand marks the point of equilibrium. In the graph below, we see that at the equilibrium price \(p*\), buyers want to buy exactly the same amount, \(q*\), that sellers want to sell.

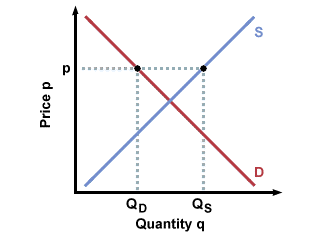
How or why do buyers and sellers meet at this point? Imagine what would happen if the price were higher than \(p*\). The following graph shows the resulting discrepancy between the quantity supplied and the quantity demanded:

Because the quantity sellers are willing to sell is much higher than the quantity buyers are willing to buy, sellers start to build up surplus inventory. Rather than sit on unsold product, they mark the product down in order to attract more buyers. (It is better to get paid a little less than you were hoping for than to get paid nothing.) At the same time, they lower their production output to avoid perpetuating the problem. Thus the price and the quantity supplied both come down. At the same time, buyers respond to the lowered price by increasing their volume of purchases; this increases the quantity demanded.
A similar dynamic occurs when the price is below the equilibrium level. Now quantity supplied falls short of quantity demanded. Suppliers realize that they could make a great deal more money by increasing output and at the same time raising prices, which they do. Consumers respond to the rising prices by demanding less.
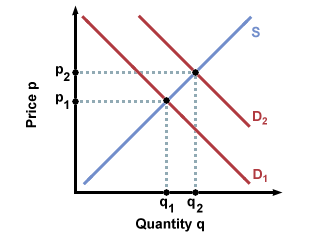
We can also see what happens when one of the curves shifts up or down in response to outside factors. Think of a product that become extremely popular for a brief time. (Croc shoes in the late 2000s, Stanley drink containers in the early 2020s, take your pick.) As the product grows in popularity, the demand curve shifts outward over time. The reason for this is that as people’s preferences change, they begin to want the product enough that they will pay much more for each unit than they would have previously. At every quantity demanded, the price is higher than it was before, and at every price, the quantity demanded is greater than it was before.

Note that this combines two effects we studied earlier: there is a shift in the demand curve, which causes a movement up the supply curve. These two effects combine to reach the new market equilibrium, which has both a higher price and a higher quantity than the previous market equilibrium.
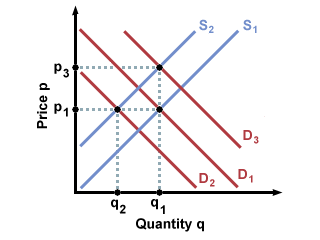
What happens if both curves shift? Will we end up at the same equilibrium point? In this model, either the price or the quantity can be the same as the previous equilibrium, but not both, unless the curves shift back to their original positions. To illustrate why this is true, consider the graph below. The initial equilibrium, between supply curve S\(_1\) and demand curve D\(_1\), has price p\(_1\) and quantity q\(_1\). If supply shifts to supply curve S\(_2\), both equilibrium price and quantity change. It is now possible to change back to our original price by shifting the demand curve to position D\(_2\), or it is possible to revert to our original quantity by shifting the demand curve to position D\(_3\). But we can’t return to the original equilibrium point unless we move the curves back to their original positions.


