An elasticity whose absolute value is 1 is the established boundary between elastic and inelastic demand or supply. A curve with an elasticity of 1 or –1 is called unit elastic. With unit elastic supply, a 10% increase in price yields a 10% increase in the quantity supplied; with unit elastic demand, a 10% price increase causes a 10% decrease in the quantity demanded.
If the elasticity of demand is less than or equal to –1, meaning that the percent change in quantity is greater than the percent change in price, then the curve will be relatively flat and elastic: small price changes will have large effects on the quantity demanded. If the elasticity of the demand curve is greater than –1, meaning the percent change in quantity is less than the percent change in price, then the curve will be steep and inelastic: it will take a big change in price to affect the quantity demanded.
Similarly, if the elasticity of supply is greater than or equal to 1, the curve will be relatively flat, with quantity supplied very responsive to changes in price. If the elasticity of the supply curve is less than 1, it will be inelastic: the curve will be steeper and quantity supplied will be less responsive to changes in price.
Elasticity on a straight-line supply or demand curve is not constant along the curve. Why is this? As you move along the curve, the slope stays constant, so that each movement yields the same amount of increase or decrease. But every point along the curve, these increases or decreases make up a different percentage of the base amount. Thus, unless elasticity is specifically stated to be constant along a curve, it should be assumed to change from point to point, and so we usually only study the elasticity of demand or supply at a specific point (usually at the equilibrium point).
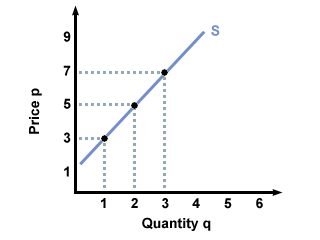
To see this point illustrated visually, consider the figure below. The slope of this hypothetical straight-line supply curve is constant (slope = 2), but the elasticity changes as you move along the graph. Let's assume that the price of this good starts at $3 and increases to $5. In this case, the elasticity for the good can be calculated as follows:
\(\text{Elasticity} = \text{% Change in Quantity}/\text{% Change in Price}\)
= \(\LARGE(2-1)/1 \over \LARGE(5-3)/3\) = \(\large3/2\)
If the price increases from $5 to $7 however, the elasticity is calculated as follows:
\(\text{Elasticity} = \text{% Change in Quantity}/\text{% Change in Price}\)
= \(\LARGE(3-2)/2 \over \LARGE(7-5)/5\) = \(\large5/4\)

The lesson? Be careful when dealing with elasticity. Don't assume that elasticity will be constant, just because you're dealing with a straight line.


