Please wait while we process your payment
If you don't see it, please check your spam folder. Sometimes it can end up there.
If you don't see it, please check your spam folder. Sometimes it can end up there.
Please wait while we process your payment
Get instant, ad-free access to our grade-boosting study tools with a 7-day free trial!
Learn more


This site is protected by reCAPTCHA and the Google Privacy Policy and Terms of Service apply.
Create Account
Select Plan
Payment Info
Start 7-Day Free Trial!

Annual
2-49 accounts
$22.49/year + tax
50-99 accounts
$20.99/year + tax
Select Quantity
Price per seat
$29.99 $--.--
Subtotal
$-.--
Want 100 or more? Request a customized plan
You could save over 50%
by choosing an Annual Plan!

SAVE OVER 50%
compared to the monthly price!
| Focused-studying | ||
| PLUS Study Tools | ||
| AP® Test Prep PLUS | ||
| My PLUS Activity | ||
$22.49/month + tax
Save 25%
on 2-49 accounts
$20.99/month + tax
Save 30%
on 50-99 accounts
| Focused-studying | ||
| PLUS Study Tools | ||
| AP® Test Prep PLUS | ||
| My PLUS Activity | ||
No Fear provides access to Shakespeare for students who normally couldn’t (or wouldn’t) read his plays. It’s also a very useful tool when trying to explain Shakespeare’s wordplay!
Erika M.
I tutor high school students in a variety of subjects. Having access to the literature translations helps me to stay informed about the various assignments. Your summaries and translations are invaluable.
Kathy B.
Teaching Shakespeare to today's generation can be challenging. No Fear helps a ton with understanding the crux of the text.
Kay H.
Create Account
Select Plan
Payment Info
Start 7-Day Free Trial!
You will only be charged after the completion of the 7-day free trial.
If you cancel your account before the free trial is over, you will not be charged.
You will only be charged after the completion of the 7-day free trial. If you cancel your account before the free trial is over, you will not be charged.
Order Summary
Annual
7-day Free Trial
SparkNotes PLUS
$29.99 / year
Annual
Quantity
51
PLUS Group Discount
$29.99 $29.99 / seat
Tax
$0.00
SPARK25
-$1.25
25% Off
Total billed on Nov 7, 2024 after 7-day free trail
$29.99
Total billed
$0.00
Due Today
$0.00
Promo code
This is not a valid promo code
Card Details
By placing your order you agree to our terms of service and privacy policy.
By saving your payment information you allow SparkNotes to charge you for future payments in accordance with their terms.
Powered by stripe
Legal
Google pay.......


Please wait while we process your payment

Sorry, you must enter a valid email address
By entering an email, you agree to our privacy policy.
Please wait while we process your payment

Sorry, you must enter a valid email address
By entering an email, you agree to our privacy policy.
Please wait while we process your payment

Your PLUS subscription has expired
Please wait while we process your payment
Please wait while we process your payment

Using the First Derivative to Analyze Functions
First, let's establish some definitions: f is said to be increasing on an interval I if for all x in I, f (x1) < f (x2) whenever x1 < x2. f is said to be decreasing on an interval I if for all x in I, f (x1) > f (x2) whenever x1 < x2. A function is monotonic on an interval I if it is only increasing or only decreasing on I.
The derivative can help us determine whether a function is increasing or decreasing on an interval. This knowledge will later allow us to sketch rough graphs of functions.
Let f be continuous on [a, b] and differentiable on (a, b). If f'(x) > 0 for all x on (a, b), then f is increasing on [a, b]. If f'(x) < 0 for all x on (a, b), then f is decreasing on [a, b].
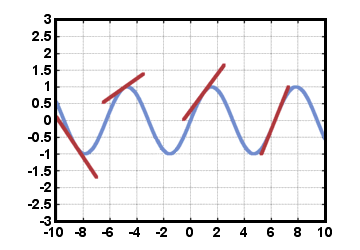
This should make intuitive sense. In the graph below, wherever the slope of the tangent is positive, the function seems to be increasing. Likewise, wherever the slope of the tangent is negative, the function seems to be decreasing:

Example: Find regions where f (x) =  x3 -
x3 -  x2 - 6x is increasing and
decreasing.
Solution:
| f'(x) | = | x2 - x - 6 | |
| f'(x) | = | (x - 3)(x + 2) |
Now we find regions where f'(x) is positive, negative, or zero. f'(x) = 0 at x = 3 and x = - 2. This can be marked on the number line:

From looking at the factors, it is clear that the derivative is positive on (- ∞, - 2), and (3,∞). The derivative is negative on (- 2, 3).

This means that f is increasing on (- ∞, - 2), and (3,∞), and that it is decreasing on (- 2, 3).
This can be indicated by arrows in the following way:

The points x = - 2 and x = 3 have horizontal tangents, which makes them critical points, but are they local extrema? It might be assumed that because f is increasing to the left of x = - 2 and decreasing to the right of x = - 2 that x = - 2 represents a local maximum. Similarly, it might be assumed that because f is decreasing to the left of x = 3 and increasing to the right of x = 3 that x = 3 represents a local minimum. This is in fact correct. This idea can be generalized in the following way:
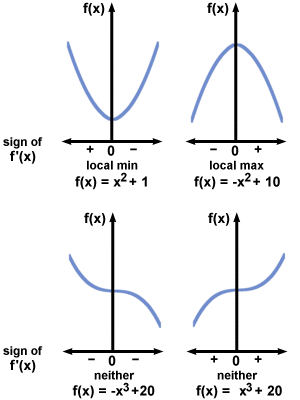
Let c be a critical number (i.e., f'(c) = 0 or f'(c) is undefined) of a continuous function f that is differentiable near x = c except possibly at x = c. Then if f'(x) is negative to the left of c and positive to the right of c, f has a local minimum at c. If f'(x) is positive to the left of c and negative to the right of c, then f has a local maximum at c. If f'(x) does not change sign at c, then (c, f (c)) is neither a local maximum nor a local minimum.
This should be clear from the figures below:

Example
Sketch a rough graph of f (x) =  x3 -
x3 -  x2 - 6x
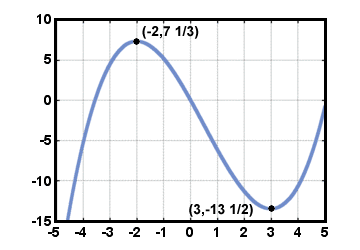
Based on previously collected data, f is increasing on (- ∞, - 2), and (3,∞)f is decreasing on (- 2, 3)f has a local max at x = - 2 and a local min at x = 3
To sketch the graph, we might want to find the exact coordinates of the critical points: f (- 2) = 7 and
f (3) = - 13
 . Using this information, a rough sketch of f might look like:

 x3 -
x3 -  x2 - 6x based on first-
derivative information
Please wait while we process your payment


