The first derivative can provide very useful information about the behavior of a graph. This information can be used to draw rough sketches of what a function might look like. The second derivative, f''(x), can provide even more information about the function to help refine the sketches even further.
Consider the following graph of f on the closed interval [a, c]:
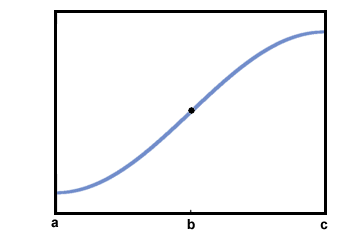
It is clear that f (x) is increasing on [a, c]. However, its behavior prior to point b seems to be somehow different from its behavior after point b.
A section of the graph of f (x) is considered to be concave up if its slope increases as x increases. This is the same as saying that the derivative increases as x increases. A section of the graph of f (x) is considered to be concave down if its slope decreases as x increases. This is the same as saying that the derivative decreases as x increases.
In the graph above, the segment on the interval (a, b) is concave up, while the segment on the interval (b, c) is concave down This can be seen be observing the tangent lines below:
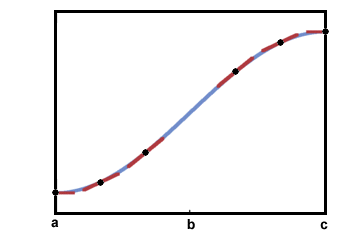
The point b is known as a point of inflection because the concavity of the graph changes there. Any point where the graph goes from concave up to concave down, or concave down to concave up, is an inflection point.
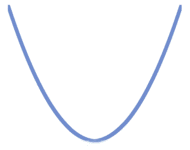
A segment of the graph that is concave up resembles all or part of the following curve:
A segment of the graph that is concave down resembles all or part of the following curve:
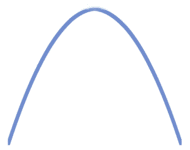
To help remember this, a common saying is "concave up makes a cup, while concave down makes a frown."
Note that for concave up curves, the slope must always be increasing, but this does not mean that the function itself must be increasing. This is because a function can be decreasing while its slope is increasing. In the left half of the concave up curve drawn above, the function is decreasing, but the slope is increasing because it is becoming less negative. At the midpoint, it finally becomes zero, and then continues to increase by becoming more positive.
As one might suspect, the second derivative, which is the rate of change of the first derivative, is closely related to concavity:
If f''(x) > 0 for all x on an interval I, then f is concave up on I. If f''(x) < 0 for all x on an interval I, then f is concave down on I.
This should make sense, because f''(x) > 0 means that f'(x) is increasing, and this is
the definition of concave up.
Example
Use the first and second derivatives to sketch a rough graph of f (x) =  x3 -
x3 -  x2 - 6x.
In the previous section, based on the first derivative, the following information was
already gathered:
- f is increasing on (- ∞, - 2), and (3,∞)
- f is decreasing on (- 2, 3)
- f has a local max at x = - 2 and a local min at x = 3
-
f (- 2) = 8
 and
and
-
f (3) = - 13


The second derivative can now be used to find the concavity of segments of the graph:
f'(x) = x2 - x - 6
f''(x) = 2x - 1
f''(x) = 0 when x = 
f''(x) > 0 (concave up) when x > 
f''(x) < 0 (concave down) when x < 
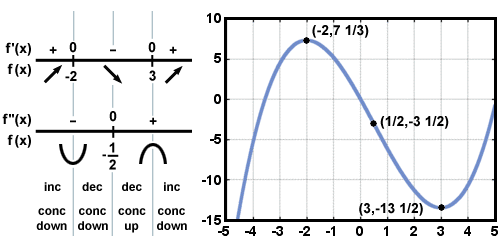
This can be schematized as:

Because the graph changes from concave down to concave up at x =  , that
point is an inflection point. Now, the information from the first and second derivative can be combined into a single
sketch blueprint:
The Second Derivative Test for Classifying Critical Points
The second derivative gives us another way to classify critical points as local maxima or local minima. This method is based on the observation that a point with a horizontal tangent is a local maximum if it is part of a concave down segment, and a minimum if it is part of a concave up segment.
Let f be continuous on an open interval containing c, and let f'(c) = 0.
- If f''(c) > 0, f (c) is a local minimum.
- If f''(c) < 0, f (c) is a local maximum.
- If f''(c) = 0, then the test is inconclusive. f (c) could be a local maximum, local minimum, or neither.
To see how this works, consider again f (x) =  x3 -
x3 -  x2 - 6x. f'(- 2) = 0. To
classify f (- 2), find the second derivative:
f''(x) = 2x - 1
f''(- 2) = - 5, which is less than zero, so the segment is concave down, and f has a local
maximum at x = - 2, confirming what has already been shown by the first derivative test.


 payment page


