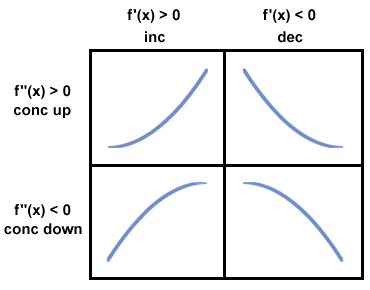
The general procedure for curve sketching is based on the material learned in the last few sections. Essentially, the first and second derivatives are used to determine which of the following pieces will be used where to form the graph:

Then, intercepts and asymptotes are found to refine the graph and make it more accurate.
Example: Sketch a graph of f (x) =  .
.
Step 1: Determine the domain of f.
In this case, f is undefined only at x = 3 and x = - 3, so the domain includes all x except those two points. These two points will turn out to be important, because places where the graph is undefined could potentially be vertical asymptotes or places where the function changes concavity or direction.
Step 2 Use the first derivative to find the critical points and determine the
direction of the graph.
A) Find the critical points
f'(x) =  = =  | |||
| f'(x) = 0 when x = 0 |
f'(x) is undefined at x = - 3 and x = + 3, but these points are not part of the domain of f, so these are not considered critical points.
B) To determine the direction of f, find the sign of f'. Mark off on a number line the
points at which f' can change sign. These include critical points and the points where
f is undefined.


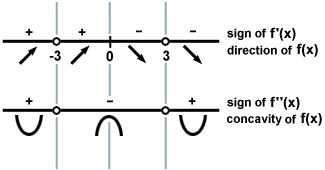
By inspection, (x2 -9)2 is always positive, so the sign of the derivative depends only on the sign of the numerator -2x. The sign of the derivative on the various intervals is filled in on the chart below with arrows to indicate the behavior of f (x).

Step Three: Use the second derivative to find the concavity and the points of
inflection.
A) First find where the second derivative equals zero
f''(x) =  f'(x) f'(x) = =    | ||||
|
|
This is never equal to zero, but is undefined at x = - 3 and x = + 3.
B) Mark off the points where the concavity could change, which are the places where the
second derivative is zero or undefined, or places where the function itself is undefined.
Then determine the sign of the second derivative on those intervals.
Since (6x2 + 18) is always positive, the sign of the second derivative will match the sign of the term (x2 - 9):

Note that even though the concavity changes at x = - 3 and at x = + 3, these are not inflection points, since f is undefined there.
Step 4: Find the horizontal and vertical asymptotes
A) To find horizontal asymptotes, take limits of the function at infinity:
  = 0 = 0 | |||
  = 0 = 0 |
Thus, y = 0 is the horizontal asymptote of f as it approaches both negative and positive infinity.
B) Candidates for vertical asymptotes are places where f is undefined.
  = + ∞ and = + ∞ and | |||
  = - ∞, = - ∞, |
so x = - 3 is a vertical asymptote. Also,
  = - ∞ and = - ∞ and | |||
  = + ∞, = + ∞, |
so x = 3 is a vertical asymptote of f.
Step 5: Find the exact coordinates of the x - and y - intercepts, the critical
points, and the points of inflection.
x-intercept: None, since  could never equal zero
y-intercept: (0, )
)
Critical Points: (0, )
)
Points of inflections: None
Step 6: Combine all of the evidence collected to graph the function
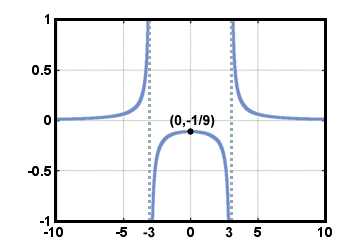
(0, ) is both the y-intercept and the only critical point.
The graph never crosses the x-axis. The information from the first and second derivative work tells us the following:

This means that f has the following behavior on the following intervals:
(- ∞, - 3): Increasing, Concave up
(- 3, 0): Increasing, Concave down
(0, 3): Decreasing, Concave down
(3,∞): Decreasing, Concave up
The line y = 0 is a horizontal asymptote at positive and negative infinity.
The lines x = - 3 and x = 3 are the vertical asymptotes. The graph must look as follows:


