Aggregate supply and aggregate demand model the effects of economic changes on the economy as a whole, including the effects of changes in economic policy.
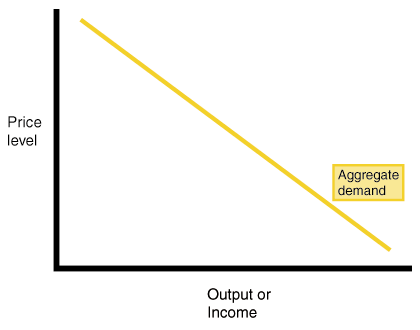
The curve that represents aggregate demand is just like any other demand curve, but it is for the sum total of all goods and services produced and purchased in an economy. On the horizontal axis, Y represents aggregate demand: the total output (real GDP) demanded at a given price level. Since for the economy as a whole, total output equals total income, Y can also be thought of as income. The vertical axis represents the price level.

The most noticeable feature of the aggregate demand curve is that it is downward-sloping. When the price level is high, aggregate demand is low; when the price level is low, aggregate demand is high.
Shifts in Aggregate Demand
Many kinds of events will cause the aggregate demand curve to shift. When the aggregate demand curve shifts to the left, the total quantity of goods and services demanded at any given price level falls. This can be thought of as the economy contracting. To understand what causes the economy to contract, recall (from the Gross Domestic Product chapter) that Y has four main components:
\(Y = C + I + G + NX\)
That is, the total output is the sum of consumer spending, investment spending, government spending, and net exports (exports minus imports). Any event that changes one or more of these factors can shift the demand curve.
Consumption, \(C\), is a function of disposable income. If disposable income decreases, consumption will also decrease. This can happen because wages go down, but it can also happen when wages stay the same and taxes go up. Conversely, a rise in wages can shift aggregate demand to the right, but so can a tax cut. Tax policy, which is part of fiscal policy, can therefore shift the aggregate demand curve.
Investment, \(I\), is a function of the interest rate. If the interest rate increases in the market for money (see the chapter on that topic), investment falls as the cost of investment rises. And if the interest rate decreases, investment rises. Because the interest rate can be influenced by monetary policy (see the chapter on that topic), monetary policy can also shift the aggregate demand curve.
The \(G\) term in the equation for \(Y\) represents government spending, another part of fiscal policy. Government budgets are regularly a source of political conflict, and so government spending tends to change depending on which interest groups have the most influence at any given time. When government spending decreases, regardless of tax policy, aggregate demand shifts to the left. When \(G\) increases, aggregate demand shifts to the right.
The fourth term that will lead to a shift in the aggregate demand curve is \(NX\). This term represents net exports, defined as exports minus imports. It is a function of the real exchange rate, discussed in the chapter on International Trade. As the real exchange rate rises, the dollar becomes stronger, causing imports to rise and exports to fall. Thus, policies that raise the real exchange rate through the interest rate will cause net exports to fall and the aggregate demand curve to shift left. By the same token, policies that lower the real exchange rate will tend to shift the aggregate demand curve to the right.


