


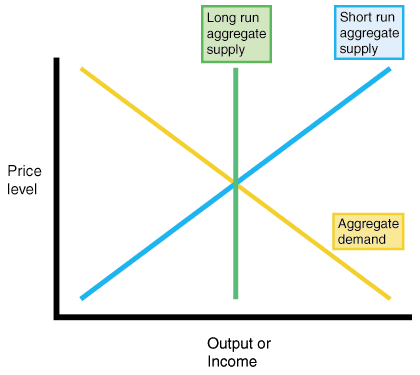
In the aggregate demand–aggregate supply (AD–AS) model, the long run equilibrium point is where the aggregate demand and long run aggregate supply curves intersect. The aggregate demand and short run aggregate supply curves may intersect somewhere else for a time, but the stable configuration in the long run is for all three curves to intersect at the same point, as shown.
AD Shifts in the AD–AS Model
The primary cause of shifts in the economy’s equilibrium is aggregate demand. Recall that aggregate demand can be affected by consumers both domestic and foreign, as well as by both fiscal and monetary policy. In general, any expansionary economic policy shifts the aggregate demand curve to the right, while any contractionary policy shifts the aggregate demand curve to the left. Eventually, though, since long run aggregate supply is fixed by the factors of production, short run aggregate supply will shift to counteract the demand shift, so that the only lasting effect of a change in aggregate demand is a change in the price level.
Let's work through an example. We begin at point A in the figure, where short run aggregate supply curve 1 meets the long run aggregate supply curve and aggregate demand curve 1.
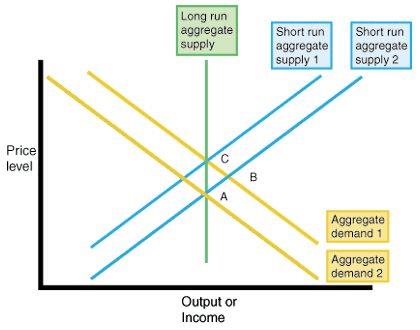
The point where the short run aggregate supply curve and the aggregate demand curve meet is always the short run equilibrium. The point where the long run aggregate supply curve and the aggregate demand curve meet is always the long run equilibrium. Thus, we are in long run equilibrium to start out.
Now say that the Fed pursues contractionary monetary policy. In this case, the aggregate demand curve shifts to the left, from aggregate demand curve 1 to aggregate demand curve 2. The intersection of the short run aggregate supply curve 1 and the aggregate demand curve 2 is point B. There, both output and the price level have decreased. This is the new short run equilibrium.
As we move to the long run, however, the expected price level comes into line with the actual price level as firms, producers, and workers adjust their expectations. When this occurs, the short run aggregate supply curve shifts along the aggregate demand curve until the long run aggregate supply curve, the short run aggregate supply curve, and the aggregate demand curve all intersect. This is represented by point C and is the new equilibrium where short run aggregate supply curve 2 equals the long run aggregate supply curve and aggregate demand curve 2. Thus, contractionary policy causes output and the price level to decrease in the short run, but in the long run only the price level decreases.
The same dynamic kicks in when the aggregate demand curve shifts to the right. Initially, both output and the price level will rise, but eventually a shift of the short run aggregate supply curve, in response to the demand shift, will bring the economy back to its original output level, at a higher price level.
This is the logic that is applied to all shifts in aggregate demand. The long run equilibrium is always dictated by the intersection of the vertical long run aggregate supply curve and the aggregate demand curve. The short run equilibrium is always dictated by the intersection of the short run aggregate supply curve and the aggregate demand curve. When the aggregate demand curve shifts, the economy always shifts from the long run equilibrium to a short run equilibrium and then back to a new long run equilibrium.
AS Shifts in the AD–AS Model
Usually, the short run aggregate supply curve only shifts in response to the aggregate demand curve. However, when a supply shock occurs, the short run aggregate supply curve shifts without prompting from the aggregate demand curve.
There are two types of supply shocks. Adverse supply shocks include things like increases in oil prices, a drought that destroys crops, and aggressive union actions. In general, adverse supply shocks cause the price level for a given amount of output to increase. This is represented by a leftward shift of the short run aggregate supply curve. Positive supply shocks include things like decreases in oil prices or an unexpectedly bountiful harvest season. In general, positive supply shocks cause the price level for a given amount of output to decrease. This is represented by a rightward shift of the short run aggregate supply curve.
Again, let's work through an example. We begin once more at point A in the figure, where short run aggregate supply curve 1 meets the long run aggregate supply curve and aggregate demand curve 1.
Now suppose that a positive supply shock occurs: a drop in the price of oil. In this case, the short run aggregate supply curve shifts to the right, from short run aggregate supply curve 1 to short run aggregate supply curve 2. The intersection of short run aggregate supply curve 2 and aggregate demand curve 1 is point B. There, output has increased and the price level has decreased. This is the new short run equilibrium.
However, as we move to the long run, aggregate demand adjusts to the new price level and output level. When this occurs, the aggregate demand curve shifts along the short run aggregate supply curve until the long run aggregate supply curve, the short run aggregate supply curve, and the aggregate demand curve all intersect. This is represented by point C and is the new equilibrium where short run aggregate supply curve 2 equals the long run aggregate supply curve and aggregate demand curve 2. Thus, a positive supply shock causes output to increase and the price level to decrease in the short run, but only the price level to decrease in the long run.
The same dynamic kicks in when the short run aggregate supply curve shifts to the left. Initially, output will fall and the price level will rise, but eventually a shift of the aggregate demand curve, in response to the supply shift, will bring the economy back to its original output level, at a higher price level.
This is the logic that is applied to all shifts in short run aggregate supply. The long run equilibrium is always dictated by the intersection of the vertical long run aggregate supply curve and the aggregate demand curve. The short run equilibrium is always dictated by the intersection of the short run aggregate supply curve and the aggregate demand curve. When the short run aggregate supply curve shifts, the economy always shifts from the long run equilibrium to a short run equilibrium and then back to a new long run equilibrium.


