


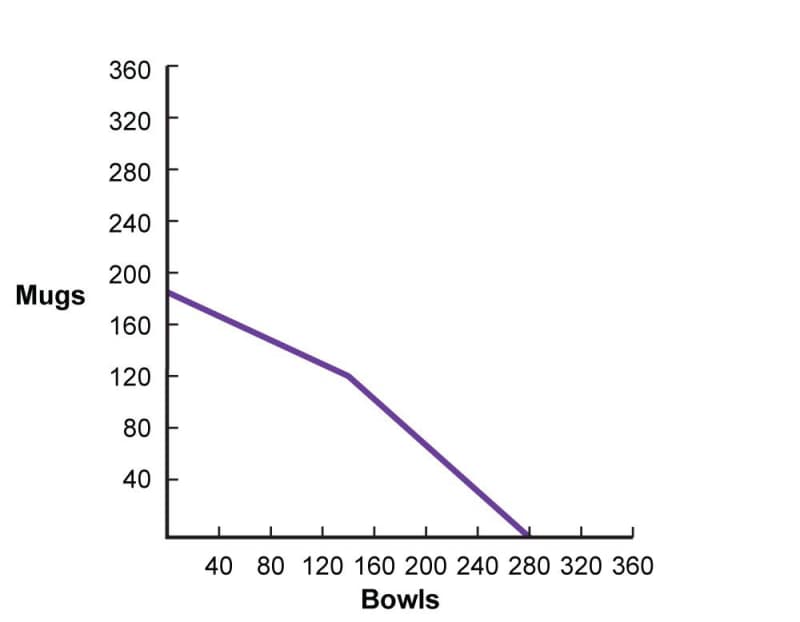
Finally, imagine that instead of running two independent shops that trade with each other, Alicia and Boris form a partnership and run a single workshop together. What does the joint production possibilities frontier of this workshop look like? Again, the endpoints are easily established: if Alicia and Boris go all-in on mug production, they can make \(120 + 65 = 185\) mugs per day. And if, on the other hand, they concentrate entirely on bowls, they can make \(150 + 130 = 280\) bowls per day.
What does the joint PPF look like between its endpoints? To answer that question, imagine that Alicia and Boris are making nothing but 185 mugs per day but decide to cut back to 181 mugs per day and use the freed-up time to make bowls. If Alicia, whose opportunity cost of 1 mug is 1.25 bowls, is the one who makes fewer mugs (116 instead her maximum of 120), then she can make \(4 \times 1.25 = 5\) bowls. But if Boris, whose opportunity cost of 1 mug is 2 bowls, is the one who makes fewer mugs (61 instead of his maximum of 65), then he can make \(4 \times 2 = 8\) bowls. Clearly, Boris is the one who should be making the switch. His opportunity cost is higher for mugs, lower for bowls.
If we continue reasoning in this way as Alicia and Boris gradually shift from mugs to bowls, we eventually reach the point where Boris is making nothing but bowls every day, 130 of them, while Alicia is still making 120 mugs. If mug production is to increase any further, Alicia has to start switching over. Since her opportunity cost of making bowls is higher than Boris’s (0.8 of a mug per bowl versus Boris’s 0.5), the PPF now slopes downward more steeply. The end of the PPF is reached when Alicia, like Boris, is making nothing but bowls. So the PPF looks like this.
The bowed-out shape of the PPF is typical of any production environment where multiple workers (or multiple pieces of equipment, or multiple types of material) can be used, and they are not all equally suited for every type of product. In general, PPFs are shown as smooth curves that get steeper and steeper as one moves from right to left:
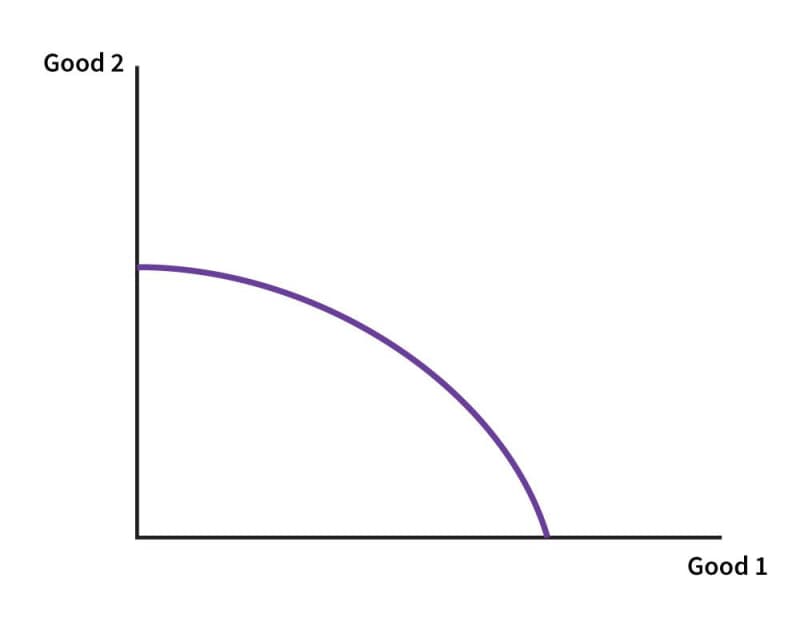
The change in slope reflects the law of increasing opportunity cost: for a firm producing goods 1 and 2 as efficiently as possible, the opportunity cost associated with a small increase in the production of good 1—opportunity cost measured in units of good 2 not made—gets larger and larger as the production volume of good 1 increases. In simpler terms: as production of good 1 increases, each additional unit of good 1 gets more expensive to make.


