


Just as we added all individual demand curves to find market demand in a product market, we use horizontal addition to add together all individual demand curves for labor to find the market demand for labor. If you have equations representing different labor demand curves, simply add them together to find the new, market demand. Graphically, add the quantities demanded at each wage level to generate a new labor demand curve.
The supply curve for the labor market as a whole is discussed in more detail in the chapter on Preference and Choice, but assume, for now, that the curve slants smoothly upward as supply curves normally do. Once you have generated market supply and demand curves for labor, finding the market equilibrium works the same way as in a goods or services market. In a perfect, unrestricted labor market this is, as usual, simply the intersection point of supply and demand.
What happens when market conditions change, causing a curve shift? For a specific example, consider the effect on the market for hot chocolate of news reports that hot chocolate causes hair loss. (This is a fictional example!) The news will likely cause a drop in the demand for hot chocolate. When demand for hot chocolate shifts inward (drops), the price of hot chocolate falls. We know this from our analysis of goods markets.
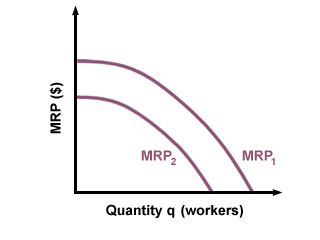
The drop in the price of hot chocolate lowers the \(MRP\) of every worker in the hot chocolate industry. Why? Say that Charlie, a worker in the hot chocolate industry, can make 1000 packets of hot chocolate every day. That is his marginal product, \(MP\). When the price, \(p\), is $1 a packet, Charlie’s \(MRP\) is $1000 per day, because \(MRP=MP×p\). If the price falls to $0.75 a packet, Charlie can still only make 1000 packets a day, and so his \(MRP\) has fallen to $750. The same thing happens to every other worker, so the entire \(MRP\) curve at the firm where Charlie works shifts downward:
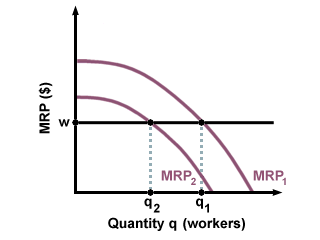
Firms such as Charlie’s will respond by reducing their workforce (or asking for fewer hours of work), because their optimal point of labor consumption has shifted inwards.
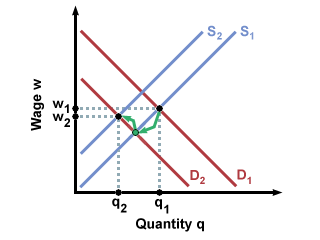
Since the drop in the \(MRP\) of labor will affect all firms in the hot chocolate industry, the market labor demand curve will shift, too. Assuming there is no change in labor supply, the net effect is that the wage paid to hot chocolate workers will drop:
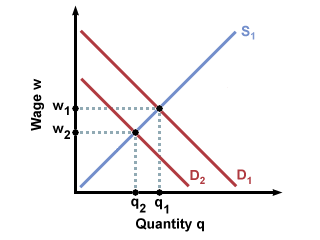
Realistically, however, labor supply will not remain unchanged. Some workers in the hot chocolate industry may find higher-paying jobs in other industries, possibly making instant coffee or powdered energy drinks. This would cause an inward shift of the labor supply curve, which would further decrease the quantity of labor used in the hot chocolate industry, and would also have the effect of raising wages paid to hot chocolate workers.