Did you know you can highlight text to take a note?
x

Please wait while we process your payment
If you don't see it, please check your spam folder. Sometimes it can end up there.
If you don't see it, please check your spam folder. Sometimes it can end up there.
Please wait while we process your payment
By signing up you agree to our terms and privacy policy.
Don’t have an account? Subscribe now
Create Your Account
Sign up for your FREE 7-day trial
By signing up you agree to our terms and privacy policy.
Already have an account? Log in
Your Email
Choose Your Plan
Individual
Group Discount
Save over 50% with a SparkNotes PLUS Annual Plan!
 payment page
Purchasing SparkNotes PLUS for a group?
Get Annual Plans at a discount when you buy 2 or more!
Price
$24.99 $18.74 /subscription + tax
Subtotal $37.48 + tax
Save 25% on 2-49 accounts
Save 30% on 50-99 accounts
Want 100 or more? Contact us for a customized plan.
payment page
Your Plan
Payment Details
Payment Summary
SparkNotes Plus
You'll be billed after your free trial ends.
7-Day Free Trial
Not Applicable
Renews June 23, 2025 June 16, 2025
Discounts (applied to next billing)
DUE NOW
US $0.00
SNPLUSROCKS20 | 20% Discount
This is not a valid promo code.
Discount Code (one code per order)
SparkNotes PLUS Annual Plan - Group Discount
Qty: 00
SparkNotes Plus subscription is $4.99/month or $24.99/year as selected above. The free trial period is the first 7 days of your subscription. TO CANCEL YOUR SUBSCRIPTION AND AVOID BEING CHARGED, YOU MUST CANCEL BEFORE THE END OF THE FREE TRIAL PERIOD. You may cancel your subscription on your Subscription and Billing page or contact Customer Support at custserv@bn.com. Your subscription will continue automatically once the free trial period is over. Free trial is available to new customers only.
Choose Your Plan
This site is protected by reCAPTCHA and the Google Privacy Policy and Terms of Service apply.
For the next 7 days, you'll have access to awesome PLUS stuff like AP English test prep, No Fear Shakespeare translations and audio, a note-taking tool, personalized dashboard, & much more!
You’ve successfully purchased a group discount. Your group members can use the joining link below to redeem their group membership. You'll also receive an email with the link.
Members will be prompted to log in or create an account to redeem their group membership.
Thanks for creating a SparkNotes account! Continue to start your free trial.
We're sorry, we could not create your account. SparkNotes PLUS is not available in your country. See what countries we’re in.
There was an error creating your account. Please check your payment details and try again.
Please wait while we process your payment
Your PLUS subscription has expired
Please wait while we process your payment
Please wait while we process your payment
Interpreting Data
After psychologists develop a theory, form a hypothesis, make observations, and collect data, they end up with a lot of information, usually in the form of numerical data. The term statistics refers to the analysis and interpretation of this numerical data. Psychologists use statistics to organize, summarize, and interpret the information they collect.
To organize and summarize their data, researchers need numbers to describe what happened. These numbers are called descriptive statistics. Researchers may use histograms or bar graphs to show the way data are distributed. Presenting data this way makes it easy to compare results, see trends in data, and evaluate results quickly.
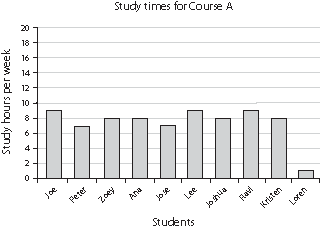
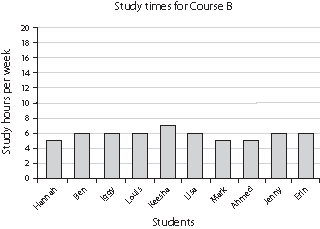
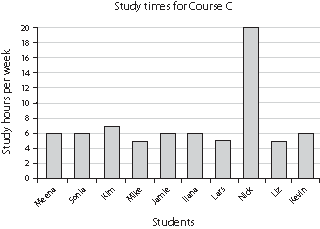
Example: Suppose a researcher wants to find out how many hours students study for three different courses. Each course has 100 students. The researcher does a survey of ten students in each of the courses. On the survey, he asks the students to write down the number of hours per week they spend studying for that course. The data look like this:
| Course A | Course B | Course C | |||
| Student | Hours per week | Student | Hours per week | Student | Hours per week |
| Joe | 9 | Hannah | 5 | Meena | 6 |
| Peter | 7 | Ben | 6 | Sonia | 6 |
| Zoey | 8 | Iggy | 6 | Kim | 7 |
| Ana | 8 | Louis | 6 | Mike | 5 |
| Jose | 7 | Keesha | 7 | Jamie | 6 |
| Lee | 9 | Lisa | 6 | Ilana | 6 |
| Joshua | 8 | Mark | 5 | Lars | 5 |
| Ravi | 9 | Ahmed | 5 | Nick | 20 |
| Kristen | 8 | Jenny | 6 | Liz | 5 |
| Loren | 1 | Erin | 6 | Kevin | 6 |
To get a better sense of what these data mean, the researcher can plot them on a bar graph. Histograms or bar graphs for the three courses might look like this:
Researchers summarize their data by calculating measures of central tendency, such as the mean, the median, and the mode. The most commonly used measure of central tendency is the mean, which is the arithmetic average of the scores. The mean is calculated by adding up all the scores and dividing the sum by the number of scores.
However, the mean is not a good summary method to use when the data include a few extremely high or extremely low scores. A distribution with a few very high scores is called a positively skewed distribution. A distribution with a few very low scores is called a negatively skewed distribution. The mean of a positively skewed distribution will be deceptively high, and the mean of a negatively skewed distribution will be deceptively low. When working with a skewed distribution, the median is a better measure of central tendency. The median is the middle score when all the scores are arranged in order from lowest to highest.
Please wait while we process your payment