Okun's Law describes a clear relationship between unemployment and national output, in which lowered unemployment results in higher national output. Such a relationship makes intuitive sense: as more people in a nation work it seems only right that the output of the nation should increase. Building on Okun's law, another economist, A. W. Phillips, discovered a relationship between unemployment and inflation. The chain of basic ideas behind this belief follows: as more people work the national output increases, causing wages to increase, causing consumers to have more money and to spend more, resulting in consumers demanding more goods and services, finally causing the prices of goods and services to increase. In other words, Phillips showed that unemployment and inflation shared an inverse relationship: inflation rose as unemployment fell, and inflation fell as unemployment rose. Since two major goals for economic policy makers are to keep both inflation and unemployment low, Phillip's discovery was an important conceptual breakthrough, but also posed a troublesome challenge: how to keep both unemployment and inflation low, when lowering one results in raising the other?
The Phillips Curve
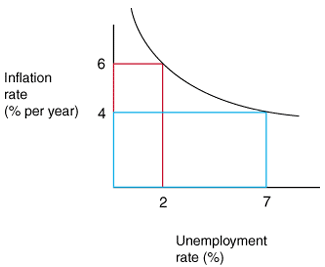
Phillips' discovery can be represented in a curve, called, aptly, a Phillips curve.

It is important to remember that the Phillips curve depicted above is simply an example. The actual Phillips curve for a country will vary depending upon the years that it aims to represent.
Notice that the inflation rate is represented on the vertical axis in units of percent per year. The unemployment rate is represented on the horizontal axis in units of percent. The curve shows the levels of inflation and unemployment that tend to match together approximately, based on historical data. In this curve, an unemployment rate of 7% seems to correspond to an inflation rate of 4% while an unemployment rate of 2% seems to correspond to an inflation rate of 6%. As unemployment falls, inflation increases.
The Phillips curve can be represented mathematically, as well. The equation for
the Phillips curve states
inflation = [(expected inflation) – B] x [(cyclical unemployment rate) +
(error)]
where B represents a number greater than zero that represents the sensitivity of
inflation to unemployment.
While the Phillips curve is theoretically useful, however, it less practically helpful. The equation only holds in the short term. In the long run, unemployment always returns to the natural rate of unemployment, making cyclical unemployment zero and inflation equal to expected inflation.
Problems with the Phillips Curve and Stagflation
In fact, the Phillips curve is not even theoretically perfect. In fact, there are many problems with it if it is taken as denoting anything more than a general relationship between unemployment and inflation. In particular, the Phillips curve does a terrible job of explaining the relationship between inflation and unemployment from 1970 to 1984. Inflation in these years was much higher than would have been expected given the unemployment for these years.
Such a situation of high inflation and high unemployment is called stagflation. The phenomenon of stagflation is somewhat of a mystery, though many economists believe that it results from changes in the error term of the previously stated Phillips curve equation. These errors can include things like energy cost increases and food price increases. But no matter its source, stagflation of the 1970's and early 1980's seems to refute the general applicability of the Phillips curve.
The Phillips curve must not be looked at as an exact set of points that the economy can reach and then remain at in equilibrium. Instead, the curve describes a historical picture of where the inflation rate has tended to be in relation to the unemployment rate. When the relationship is understood in this fashion, it becomes evident that the Phillips curve is useful not as a means of picking an unemployment and inflation rate pair, but rather as a means of understanding how unemployment and inflation might move given historical data.


 payment page


