Downward sloping aggregate demand curve

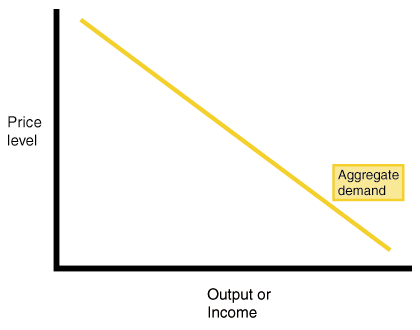
The most noticeable feature of the aggregate demand curve is that it is downward sloping, as seen in . There are a number of reasons for this relationship. Recall that a downward sloping aggregate demand curve means that as the price level drops, the quantity of output demanded increases. Similarly, as the price level drops, the national income increases. There are three basic reasons for the downward sloping aggregate demand curve. These are Pigou's wealth effect, Keynes's interest-rate effect, and Mundell-Fleming's exchange-rate effect. These three reasons for the downward sloping aggregate demand curve are distinct, yet they work together.
The first reason for the downward slope of the aggregate demand curve is Pigou's wealth effect. Recall that the nominal value of money is fixed, but the real value is dependent upon the price level. This is because for a given amount of money, a lower price level provides more purchasing power per unit of currency. When the price level falls, consumers are wealthier, a condition which induces more consumer spending. Thus, a drop in the price level induces consumers to spend more, thereby increasing the aggregate demand.
The second reason for the downward slope of the aggregate demand curve is Keynes's interest-rate effect. Recall that the quantity of money demanded is dependent upon the price level. That is, a high price level means that it takes a relatively large amount of currency to make purchases. Thus, consumers demand large quantities of currency when the price level is high. When the price level is low, consumers demand a relatively small amount of currency because it takes a relatively small amount of currency to make purchases. Thus, consumers keep larger amounts of currency in the bank. As the amount of currency in banks increases, the supply of loans increases. As the supply of loans increases, the cost of loans--that is, the interest rate--decreases. Thus, a low price level induces consumers to save, which in turn drives down the interest rate. A low interest rate increases the demand for investment as the cost of investment falls with the interest rate. Thus, a drop in the price level decreases the interest rate, which increases the demand for investment and thereby increases aggregate demand.
The third reason for the downward slope of the aggregate demand curve is Mundell-Fleming's exchange-rate effect. Recall that as the price level falls the interest rate also tends to fall. When the domestic interest rate is low relative to interest rates available in foreign countries, domestic investors tend to invest in foreign countries where return on investments is higher. As domestic currency flows to foreign countries, the real exchange rate decreases because the international supply of dollars increases. A decrease in the real exchange rate has the effect of increasing net exports because domestic goods and services are relatively cheaper. Finally, an increase in net exports increases aggregate demand, as net exports is a component of aggregate demand. Thus, as the price level drops, interest rates fall, domestic investment in foreign countries increases, the real exchange rate depreciates, net exports increases, and aggregate demand increases.
IS-LM model of aggregate demand
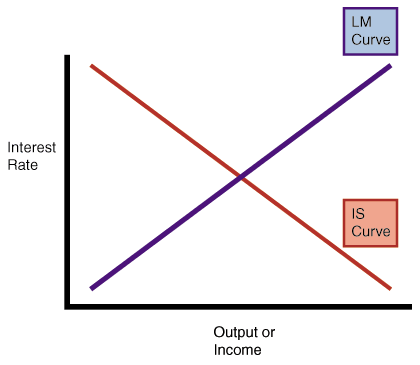
There is another major model that is useful for explaining the nature of the aggregate demand curve. This model is called the IS-LM model after the two curves that are involved in the model. The IS curve describes equilibrium in the market for goods and services where Y = C(Y - T) + I(r) + G and the LM curve describes equilibrium in the money market where M/P = L(r,Y). The IS-LM model exists in a plane with r, the interest rate, on the vertical axis and Y, being both income and output, on the horizontal axis. The IS-LM model has the same horizontal axis as the aggregate demand curve, but a different vertical axis.

The IS curve describes equilibrium in the market for goods and services in terms of r and Y. The IS curve is downward sloping because as the interest rate falls, investment increases, thus increasing output. The LM curve describes equilibrium in the market for money. The LM curve is upward sloping because higher income results in higher demand for money, thus resulting in higher interest rates. The intersection of the IS curve with the LM curve shows the equilibrium interest rate and price level.


 payment page


