A function is a special kind of relation that pairs each element of one set with exactly one element of another set. A function, like a relation, has a domain, a range, and a rule. The rule is the explanation of exactly how elements of the first set correspond with the elements of the second set. A function is defined by its rule; some texts actually make no distinction between the rule of a function and the function itself. The domain and range of a function can typically be determined given the rule of the function.
Symbolically, a function can be illustrated with a simple drawing. Below in the
figure are the sets A and B. The points in each set are the elements of the
sets. The function f is shown on the left, and the relation g is shown on
the right.

Functions are generally denoted by a single letter. The domain of a function is the set of all inputs for which the function assigns an output. The range of a function is the set of all outputs of the function. The inputs, or elements of the domain, are called the independent variable of the function, and the outputs are the dependent variable. This is because the outputs of the functions depend on the inputs. If an element is input into a function, and no output can be assigned, then the function is undefined for that element. Such an element is not in the domain of the function.
Let's examine a simple function in what is called "function notation": y = f (x) = 2x. The name of the function is f. The independent variable is x, and the dependent variable is y. The rule of the function is y = 2x. f (x), or y, is the value of the function at x. f (x) is read "f of x." If for a given input x there exists an output y that satisfies the rule, then f is defined at x. If there exists no output y that satisfies the rule for a given input x, then the function is undefined at x. The domain is the set of all x for which the function is defined. The range is the set of all y that could be taken by the function for some input value of x.
It will become useful to eventually think of a function and its rule as one and the same thing. A function is defined by its "rule" -- it is what associates the elements of one set with another. In function notation, a function is equivalent to its rule. In the example above, f (x) = 2x. From this we know that the domain of f will consist of any number that can be doubled, which is the set of real numbers. The range will consist of these numbers doubled, which is also the set of real numbers.
Many real-life situations can be modeled by a function or by several functions.
Take the opening of a new retail store for example. A lot of money is required
to build a store, decorate it, and stock it with merchandise. All of this money
must be spent before the store opens for business. If the business is
successful, the store's income will exceed its expenses per unit time, and
eventually the store will make back all of the money needed to start it and make
an overall profit. Let the initial expenses of the store equal $40,000, and
for simplicity's sake, let the daily profit of the store equal $200. The net
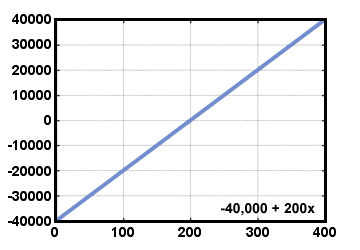
profit of the store can be easily modeled by a simple function. Let the
function be called p. Let the independent variable x be the number of days
the store is open, and let the dependent variable y be the net profit of the
store. Then y = p(x) = - 40, 000 + 200x. The graph of the function looks like
this:

When a relation is graphed, there is an easy way to verify whetheer it is a function. It is a convention in math to designate x the independent variable, and designate y the dependent variable. Thus, for every x in the domain of the function, there must only be one corresponding y in the graph. The vertical line test shows us this. If a vertical line can be placed in the graph such that it intersects with the graph of a relation more than once, that relation is not a function. The graph of a function does not intersect with any vertical line more than once.
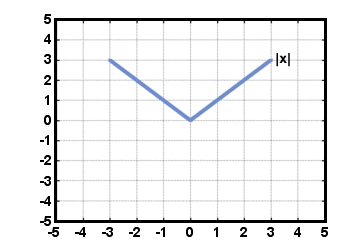
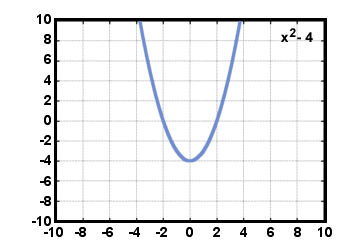
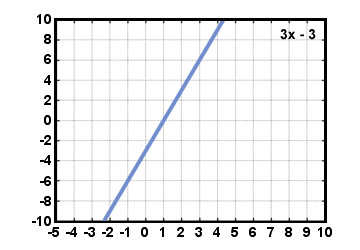
Below are some graphs of functions. Study the domain and range of the functions. Also practice verifying whether they are indeed functions by performing the vertical line test.


 payment page


