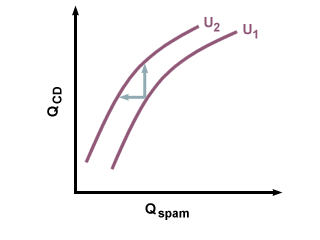
For instance, if one good is a normal good, such as CDs, and the
other good is an undesirable good, such as Spam, the indifference
curves will look like this, with the second indifference curve being better
than the first:

Utility Curves for Normal and Undesirable Goods
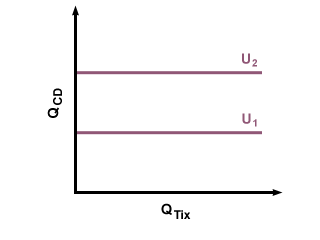
What if the consumer doesn't care about one of the goods, meaning
that getting more or less of that good doesn't make them happier or
unhappier? For instance, replace the Spam with expired baseball
tickets. Jim likes getting CDs, but really doesn't care how many
expired baseball tickets he gets. This makes his indifference curves
look like this:

Indifference Curves for Normal and Neutral Goods
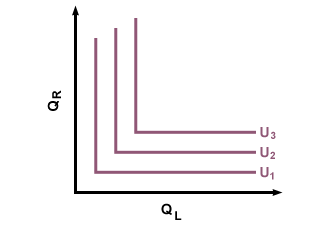
Another instance in which indifference curves behave strangely is in the case of complementary goods. Demand for complementary goods is directly related. In other words, buying one good increases the probability you'll buy the other good, those two goods are complementary. Mittens are an extreme example of complementary goods: if you buy a right mitten, it is almost a sure bet that you'll buy a left mitten. This also means that having extra stray mittens isn't likely to increase your utility. There is virtually no difference in your happiness whether you have one right mitten and one left mitten, or two right mittens and one left mitten. This shows up in the following indifference curves (note that only a simultaneous increase of right and left mittens will result in increased utility).

Indifference Curves for Complementary Goods: Mittens
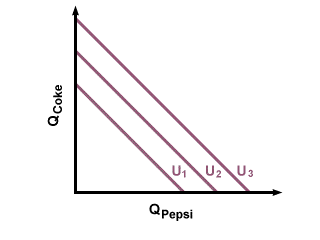
What if the two goods being evaluated are pretty much the same? Such goods are called substitute goods: the buyer considers them to be interchangeable. One example of perfect substitutes (though some might argue otherwise) could be Coke and Pepsi. If you consider them to be the same thing, then you don't mind which one you get. More is still better, but you don't care what combination of the two you get, which means that when you have a lot of Pepsi, you would not be willing to trade three cans of Pepsi for one can of Coke, eliminating the inward bend of the indifference curves. This results in indifference curves like this:

Indifference Curves for Substitute Goods: Cola
Utility Optimization
While it is impossible to know exactly what goes on inside a buyer's head while they are making a decision, we can assume that a normal person will choose whichever combination will make them as happy as possible, given their choices and their budget. On the graph, this means that they will choose whichever combination lands them on the highest indifference curve possible. We can see this optimization if we draw in the consumer's budget constraint on the same graph as the consumer's indifference curves.
To draw a budget constraint, a line that shows the maximum amount of goods a buyer can purchase with their available funds, you need to know two things: 1) how much money they have, and 2) the prices of the two goods being considered. Once you have both pieces of information, it is simply a matter of finding out the maximum amount of the first good you can buy, without buying any of the second, then finding the maximum amount of the second good you can buy, without buying any of the first. Mark these points on the graph and connect them. To illustrate, suppose Tina has $100. She is deciding how many bottles of wine and how many wine glasses she wants to buy. If wine costs $20 a bottle and glasses cost $5 each, then the most wine she can buy is ($100/$20)=5 bottles. Likewise, she can buy at most ($100/$5)=20 wine glasses. Her budget constraint would look like the darker line, while the filled area includes all of her possible buying decisions, given the amount of money she has. Anything not included in the colored area is out of her budget:


 payment page


